

Series
The Atelier Nord series: a Power BI report you can click
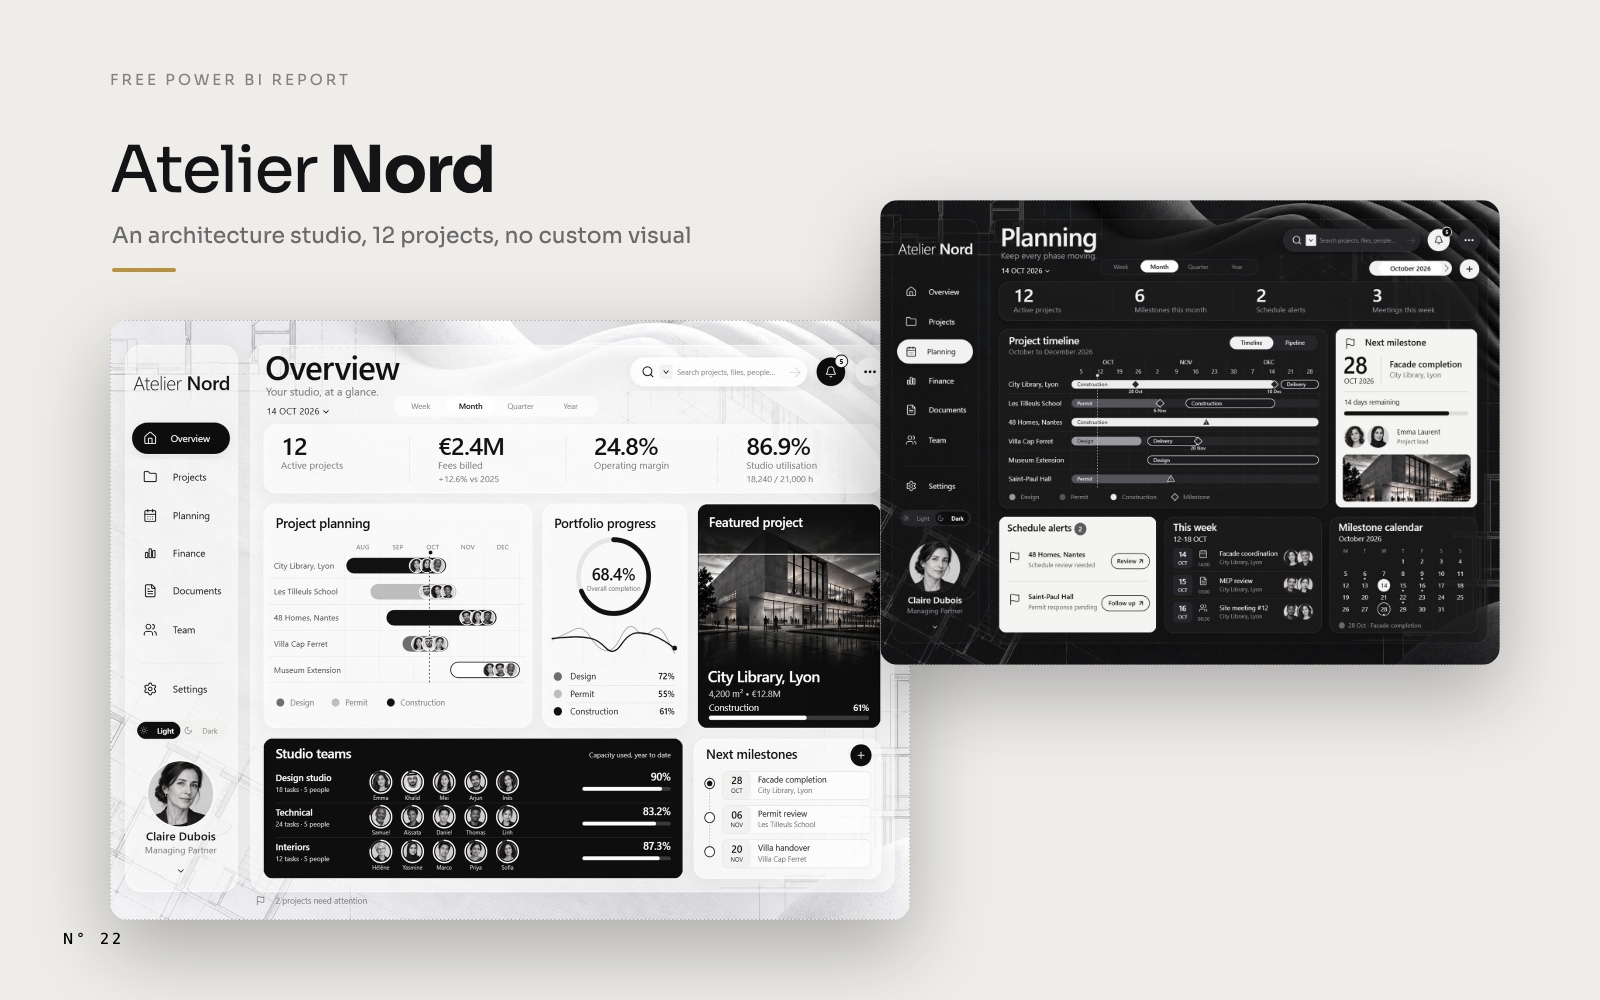
Atelier Nord is a free Power BI report for a fictional architecture studio in Lyon, with no custom visual. Its drawings are table rows you can click, hover and drill into. The series starts with the report itself, then explains one technique per article.
Open the Atelier Nord page4 articles
 Free reports2 November 202610 min read
Atelier Nord: a free Power BI report for an architecture studio
Download Atelier Nord, a free Power BI report for an architecture studio: a Gantt you can click, hover and drill into, Light and Dark mode, no custom visuals.SVG and DAX visualsSlicers and navigationPage design and theming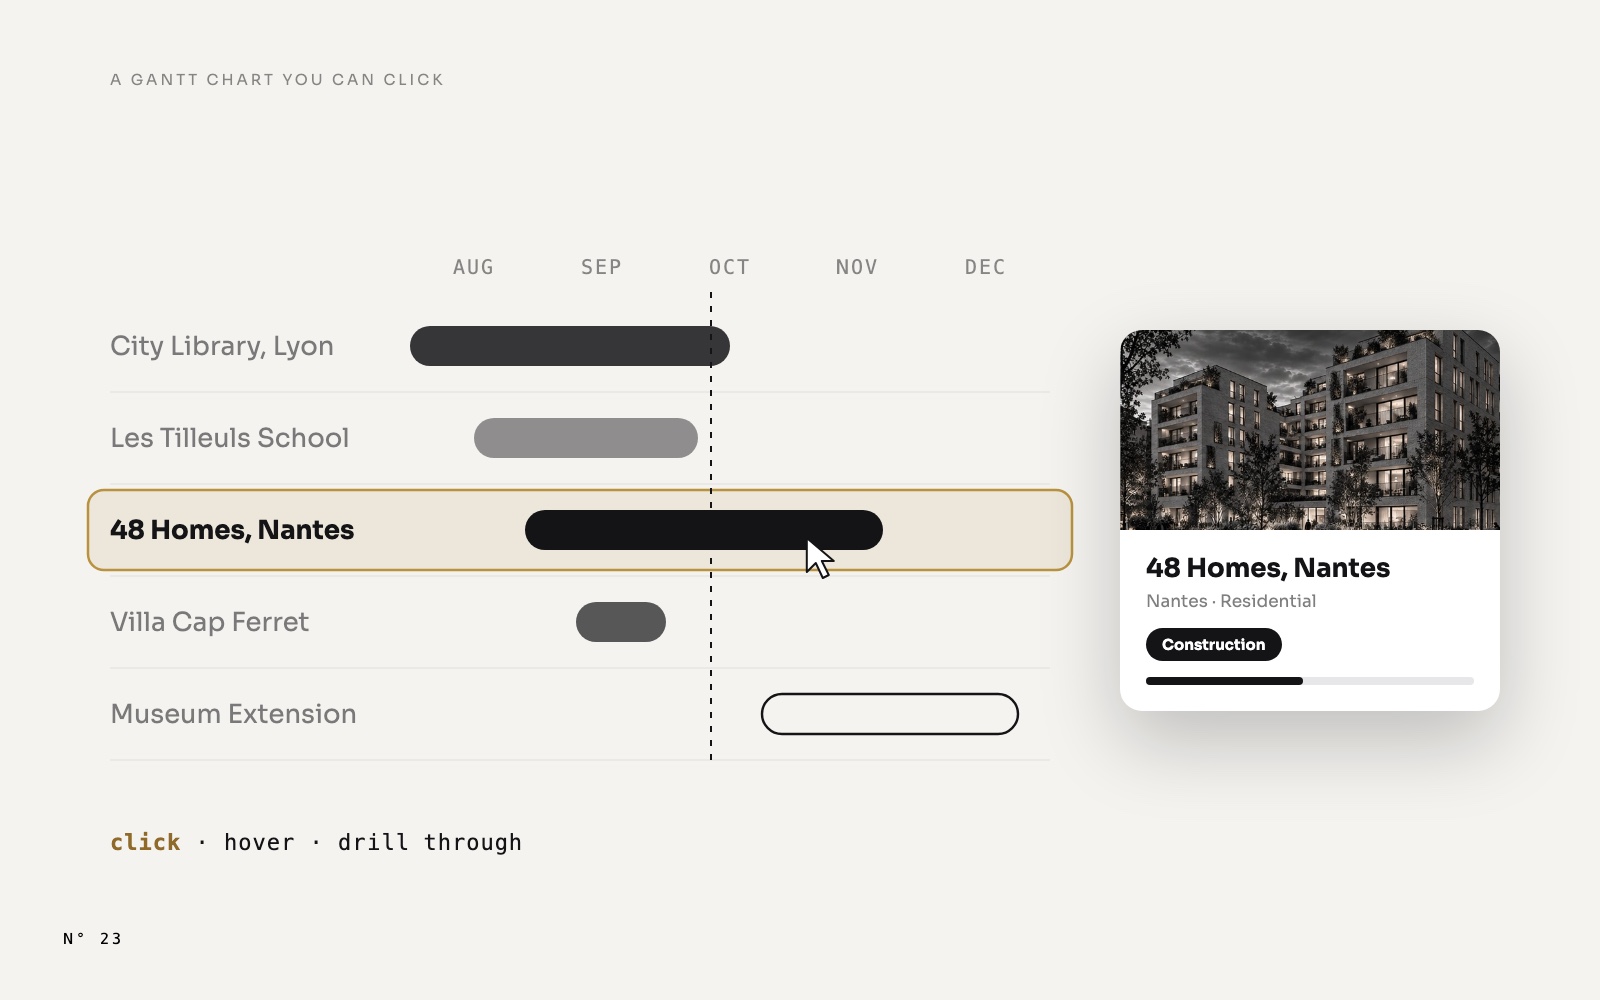 Design techniques8 November 202613 min read
A Power BI Gantt chart you can click, hover and drill into, with no custom visual
Each row of this Gantt is a native table row drawn by an SVG measure. So it selects, shows a report page tooltip and drills through, with no custom visual.SVG and DAX visualsSlicers and navigationAnimation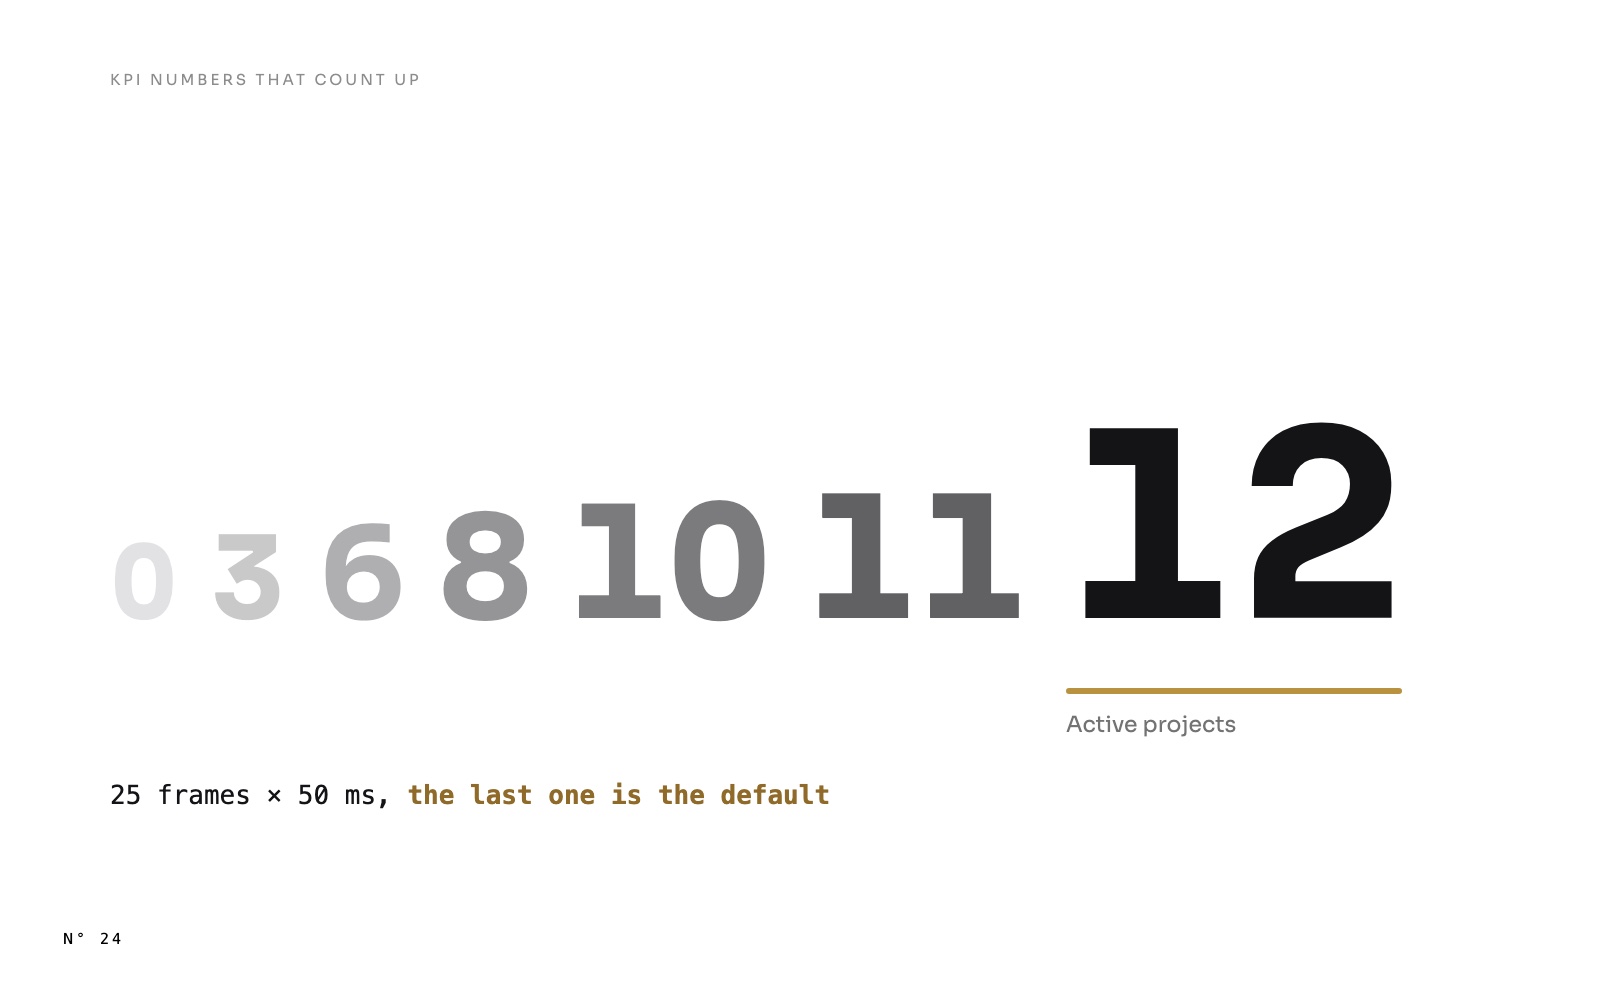 Design techniques8 November 20268 min read
KPI numbers that count up in Power BI, with one DAX measure
SVG can't animate a number. So this DAX measure writes 25 versions of it and shows each one for 50 ms: KPIs that count up from zero, in any native card.AnimationSVG and DAX visuals Design techniques8 November 20268 min read