

Topic
Power BI maps without Azure Maps
Azure Maps asks for a sign-in and moves on its own. These articles draw maps another way: a scatter chart over a map image, a floor plan with the Synoptic Panel, and route maps where one DAX measure projects the airports and draws the arcs.
4 articles
 Design techniques24 October 202610 min read
A route map drawn by a DAX measure: arcs, airports and a map that frames itself
No map visual: one SVG measure projects airports, draws the period's routes as arcs weighted by traffic, labels the busiest without overlap and reframes itself.MapsSVG and DAX visuals Design techniques24 October 20269 min read
The jet that stops where the flight is: SVG motion in a Power BI measure
Make a jet fly along its route and stop at the share of the flight already flown, with SVG animateMotion written by a DAX measure, in a native card.AnimationSVG and DAX visualsMaps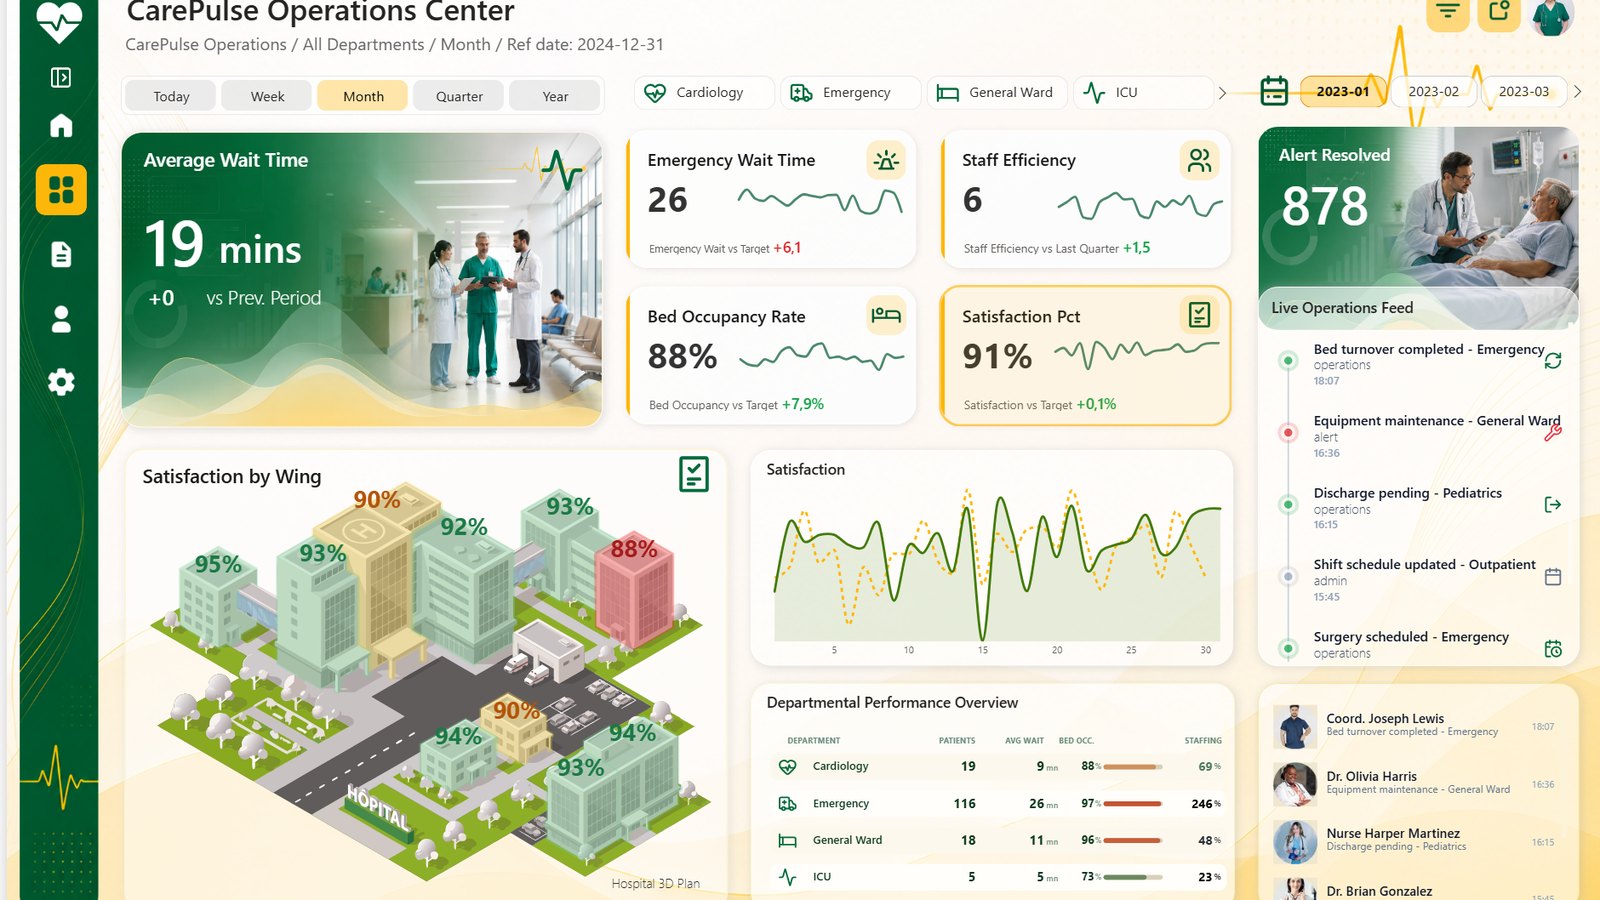 Free reports22 October 20264 min read
A hospital floor plan as a Power BI map
CarePulse shows hospital operations on the plan of the campus itself: ten wings coloured by wait time, staffing, bed occupancy or satisfaction. A free Power BI report.Maps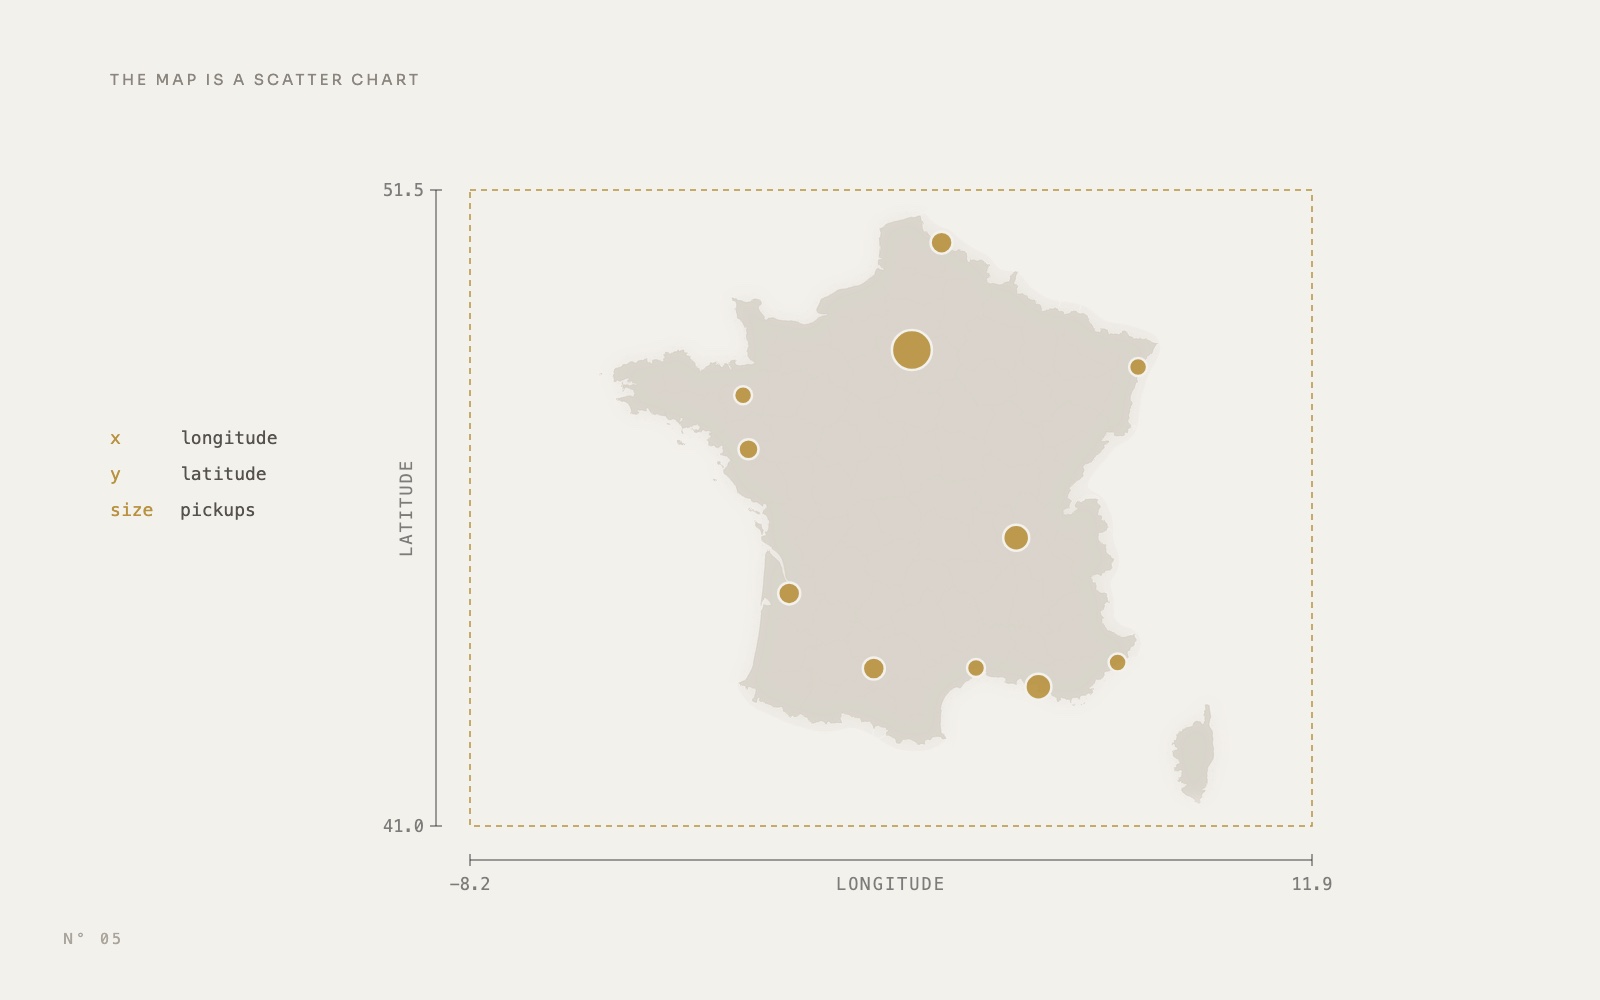 Design techniques14 October 20269 min read