

Free Power BI project
Atelier Nord, a Power BI report you can click.
A fictional architecture studio and its report: a planning you can click, hover and drill into, KPIs that count up, a building that rises to its progress, Light and Dark mode. Native visuals and DAX, live in the Power BI Service. Free to download and take apart.
1.7 MB zip · PBIP, PBIR, TMDL, Parquet · Power BI Desktop for Windows
- report pages
- 4report pages
- visuals
- 136visuals
- DAX measures
- 192DAX measures
- custom visuals
- 0custom visuals
- timesheet lines
- 39,328timesheet lines
The report
Four pages, and a page per project.
Overview, Projects, Planning and Finance answer a partner's Monday questions. Any project opens its own page, and every table of projects shows its card on hover.
Four KPIs that count up, the project planning you can click, portfolio progress, the featured project, the studio teams and the next milestones.
Light and Dark
One slicer,
two studios.
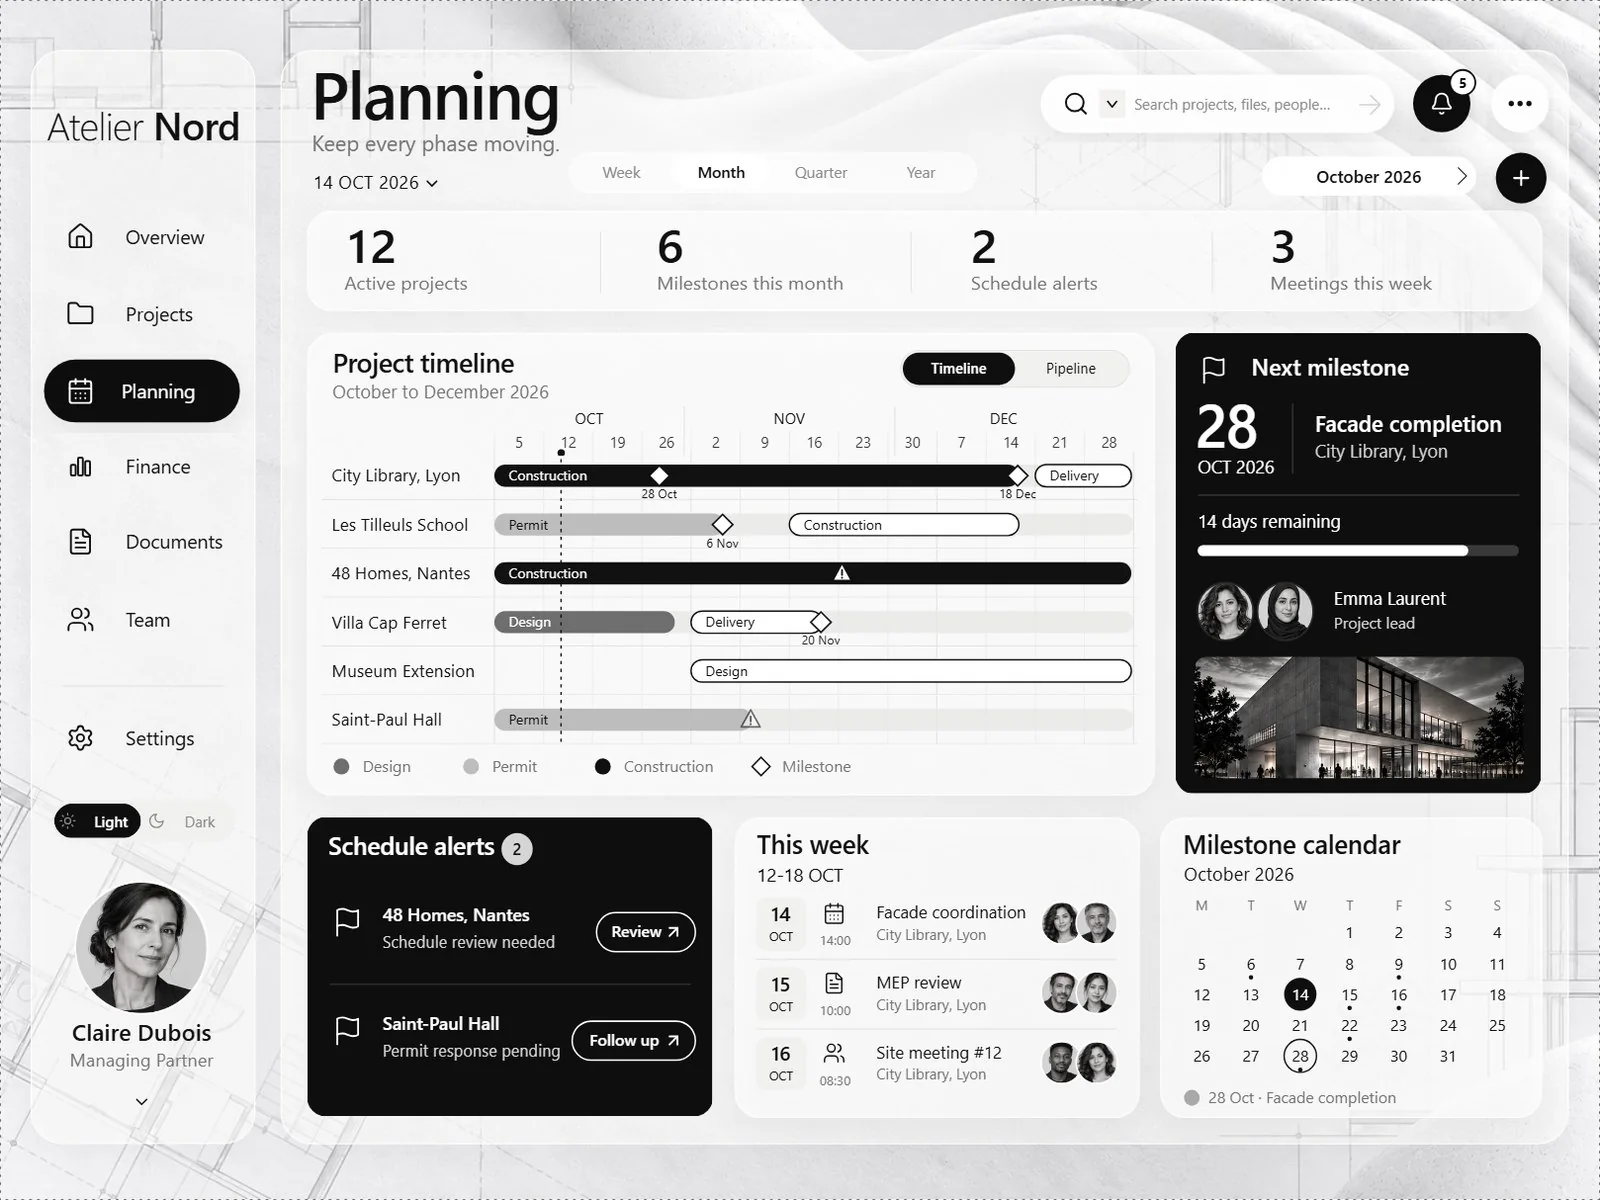
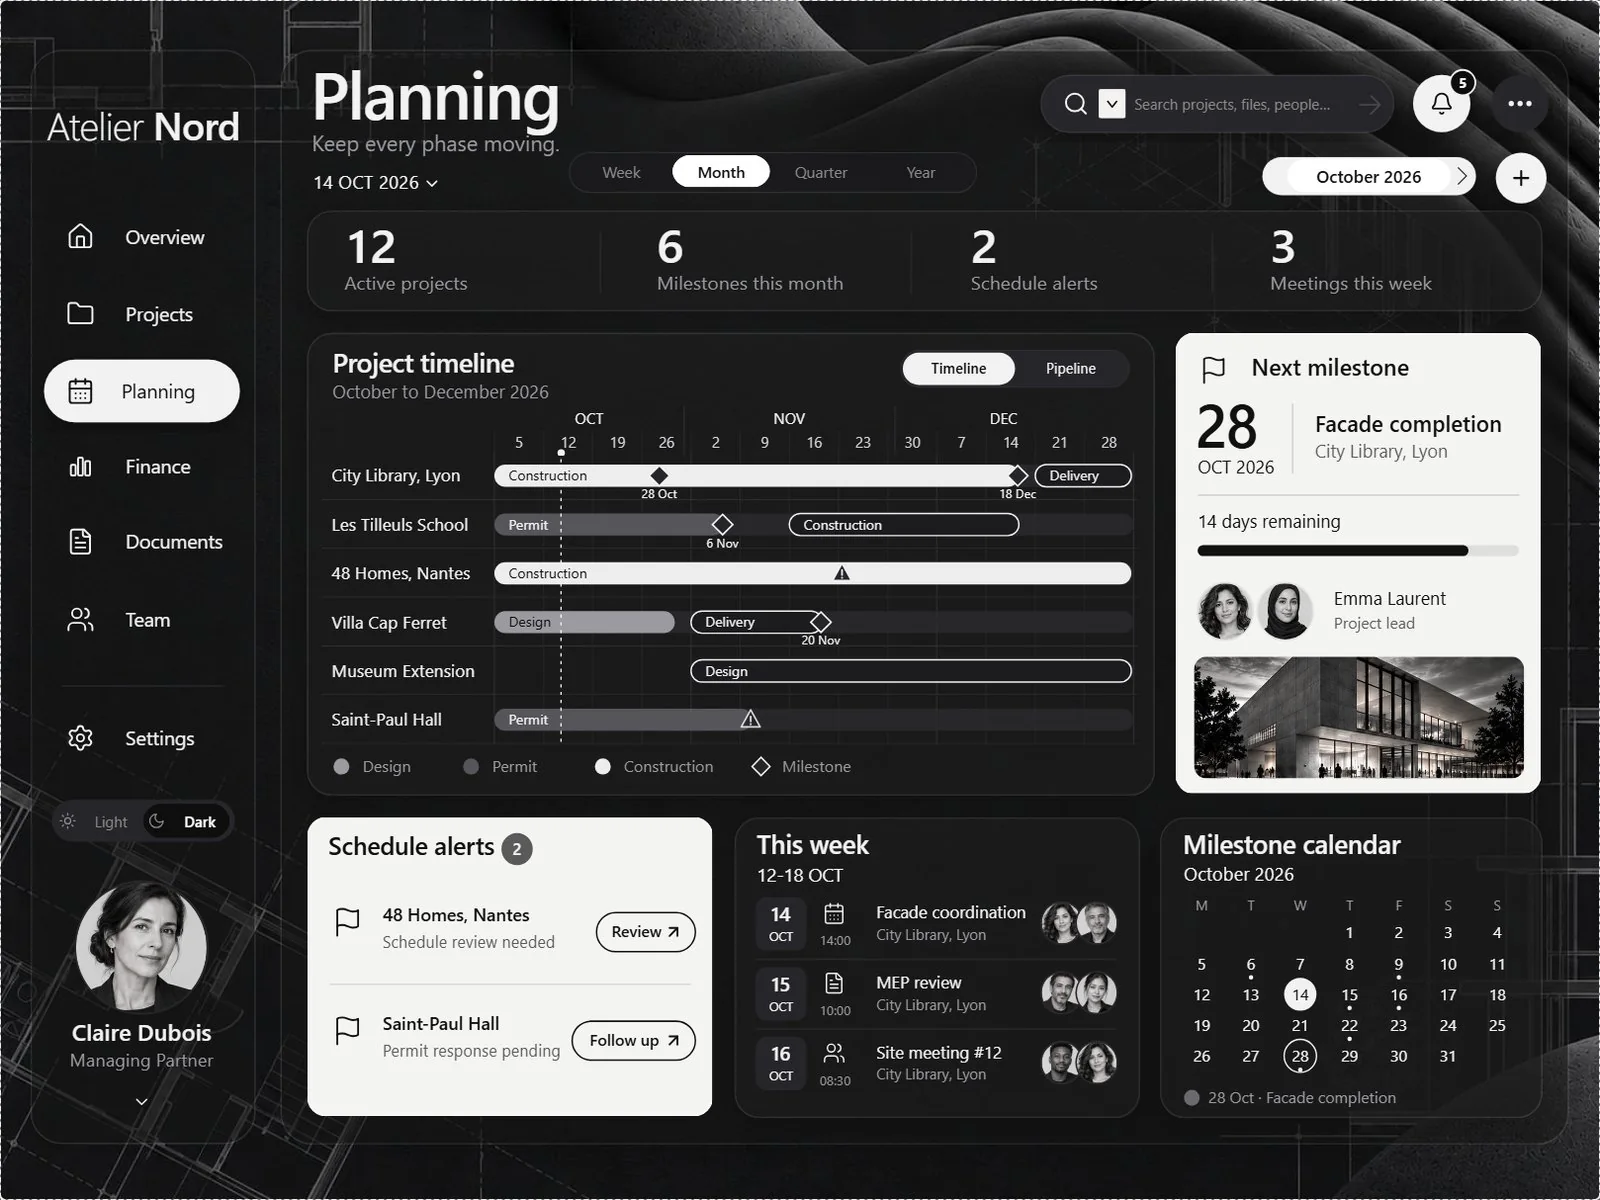
Every colour of every drawing is a DAX measure that reads the theme slicer. In Dark, the plaster gives way to the same architectural plans on black paper, behind smoked glass.
What's inside
A real project, not a screenshot.
The report and its data as Power BI Desktop opens them, minus the caches. Open them in VS Code, read the measures, reuse the techniques.
AtelierNord.zip · 1.7 MB
AtelierNord/
├── AtelierNord.pbip            the file to open
├── AtelierNord.Report/         PBIR, one JSON per visual
├── AtelierNord.SemanticModel/  TMDL, 192 measures
├── data/                       17 Parquet files
└── README.md                   how to open it, EN and FR
- PBIP
- PBIR
- TMDL
- Parquet
- SVG
136 visuals. Not one is a chart.
Every chart, Gantt, gauge and map you see is an SVG image drawn by a DAX measure, inside a native card or a native table row.
- Buttons55
- Cards47
- Slicers19
- Images10
- Tables5
- Chart visuals0
- Custom visuals0
How it works
Five techniques,
all native.
The drawings are table rows, so they can be clicked, hovered and drilled like data. The article walks through each technique.
- 01
A Gantt you can click
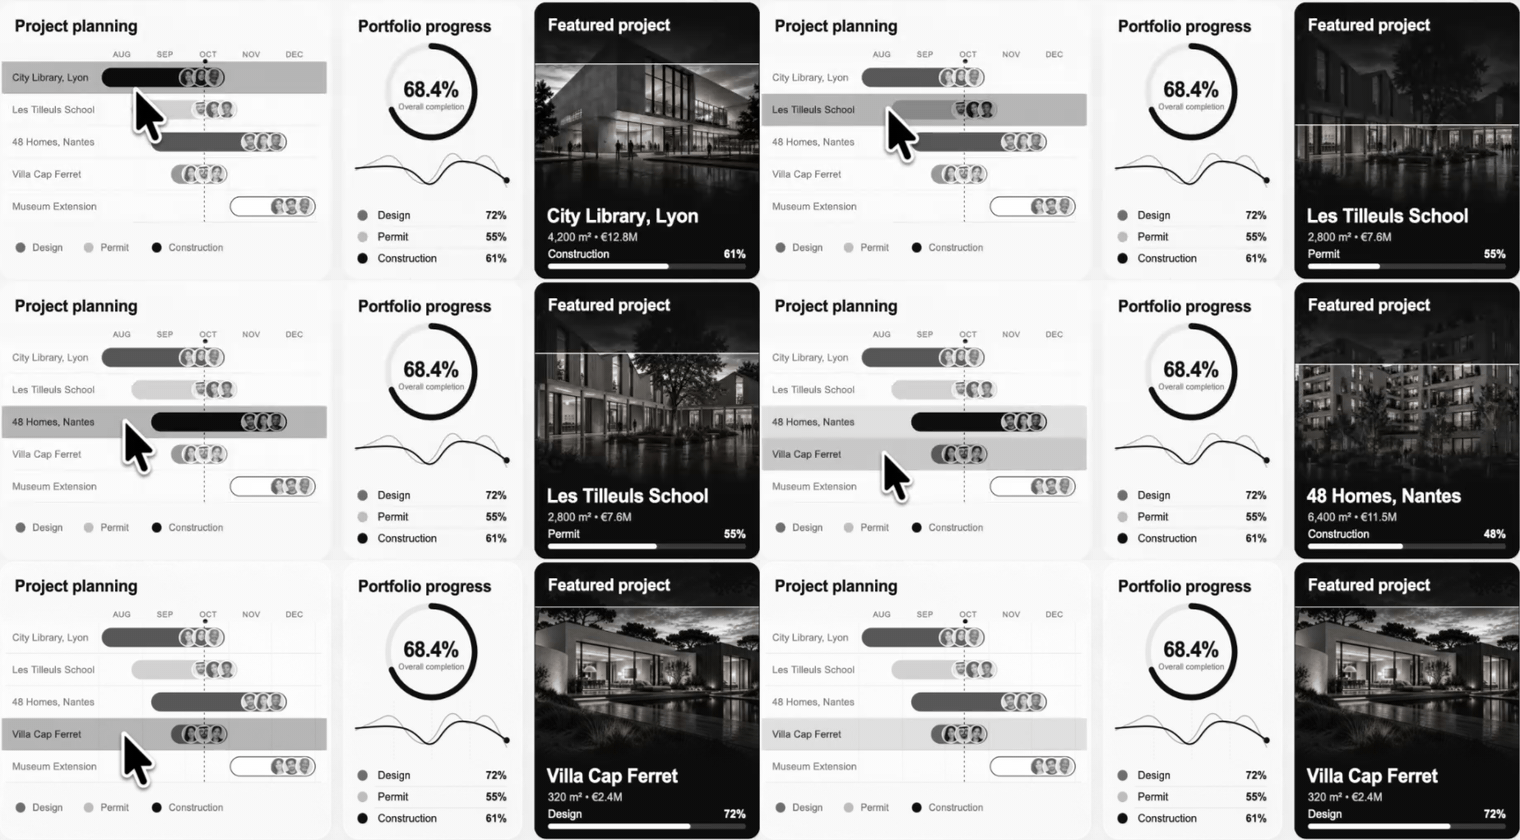
Each row is a native table row drawn by an SVG measure. Click it and the featured project follows.
- 02
A card on hover
A hidden report page is the tooltip of every project table: render, phase, budget, hours and team.
- 03
A page per project
Drill through from any row: the building rises to its progress, next to its hours and its map.
- 04
Numbers that count up
Each KPI is 25 frames of its text, shown one after the other. The last frame is the default.
- 05
Light and Dark
Every colour is a measure. In Dark, the plaster gives way to the plans on black paper, behind smoked glass.
How it was built
From four mockups,
page by page.
An AI agent wrote every file and checked its own render in Power BI Desktop, clicks, hovers and drill-throughs included. The design calls stayed human.
- 01
Mockups
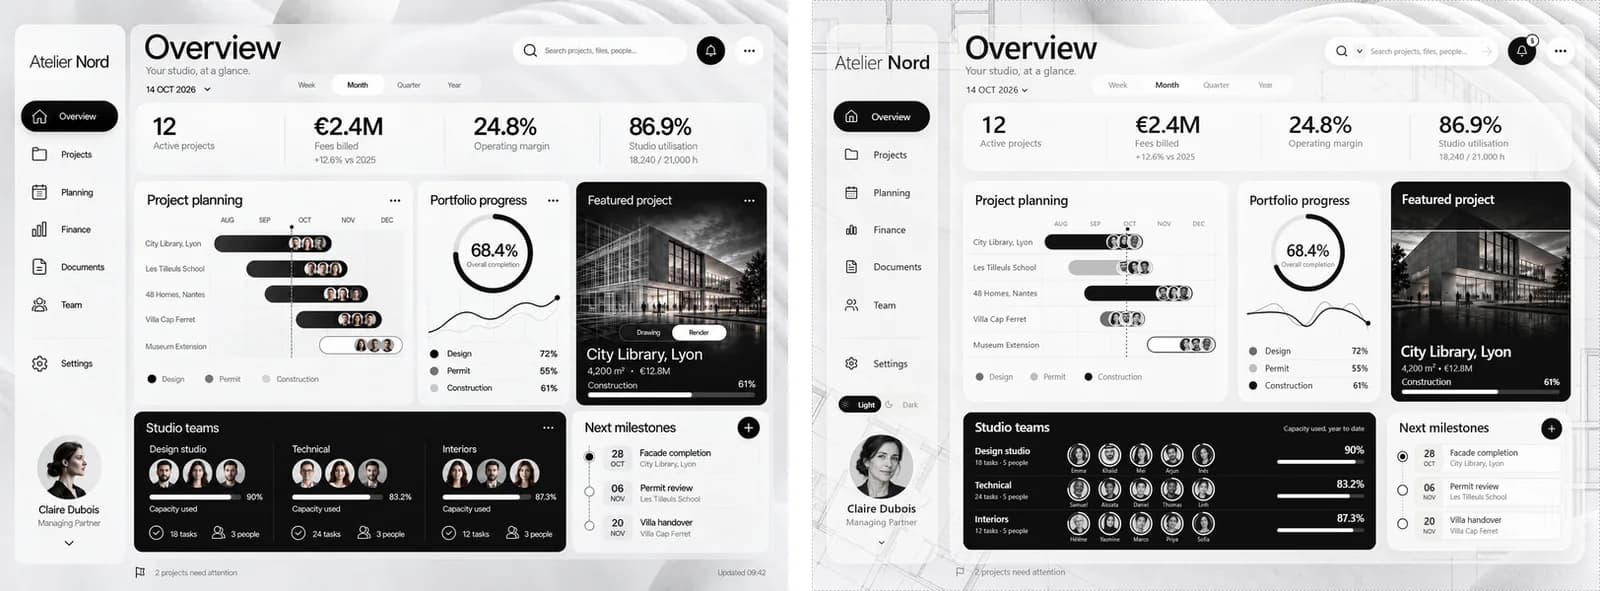
Four images from an image model, one per page: Overview, Projects, Planning and Finance. They are the brief.
- 02
Data and model
Python generates 19 projects and 39,328 timesheet lines, calibrated on the mockups. The model is TMDL: 31 tables, 192 measures.
- 03
Drawings
Every card and every table row is a DAX measure that returns an SVG image, with its animation and its Light and Dark colours.
- 04
The Desktop loop
After each change, the report is reopened in Power BI Desktop, captured page by page, then clicked, hovered and drilled.
- 05
Review
Each round is reviewed against the mockups. The design direction, the renders and the final touches stay human.
Open it
Three steps, then refresh.
- 01
Unzip
Extract the folder to
C:\AtelierNord. - 02
Open
Open
AtelierNord.pbipin Power BI Desktop. - 03
Refresh
Click Refresh. The data loads from the Parquet files in seconds.
Unzipped somewhere else? In Desktop, open Transform data, then Edit parameters, and point DossierDonnees to the data folder. In Desktop, hold Ctrl to click the report buttons.
ChartCraft Bespoke
A report like this,
on your own model.
Atelier Nord is a showcase on a fictional model. ChartCraft Bespoke designs and builds reports like this one for your team, on your own semantic model.
Questions
Before you open it, the answers.
Released under the MIT License. Icons by Lucide (ISC License). France map drawn from france-geojson (Etalab Open Licence 2.0). Renders, portraits, backgrounds and mockups generated with AI.