

TeamBeta
Power BI reports your whole team can reuse.
Nine report pages, drawn by hand and proven in Power BI Desktop. Set your brand once, download a canvas, point it at an Excel workbook. Free while in beta.
Free while in beta · Power BI Desktop on Windows · your numbers in an Excel workbook
The library
Nine pages, one per team.
Each one is a real Power BI report page, drawn by hand, with sample data you replace. Pick an example brand to see how yours would sit.
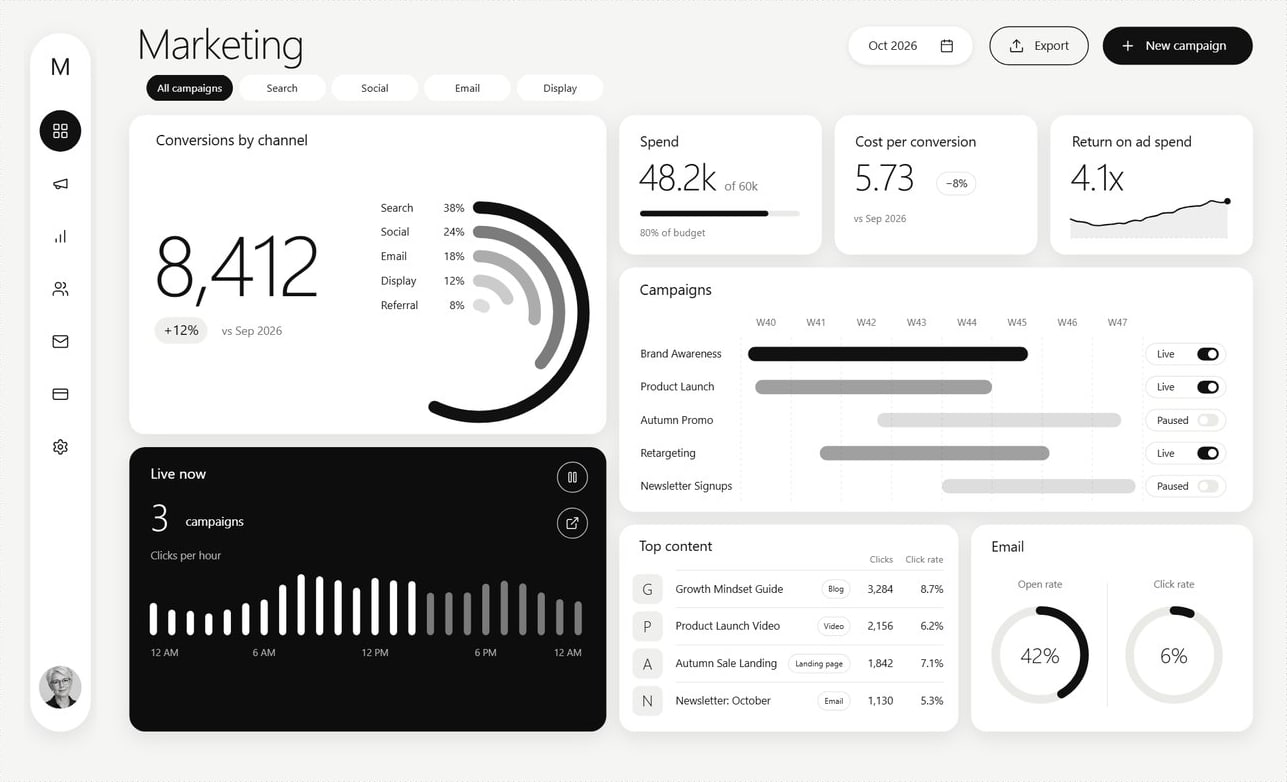
Marketing
Growth · 7 tables · Portraits
Spend, clicks and conversions by channel this month, with campaigns and top content.
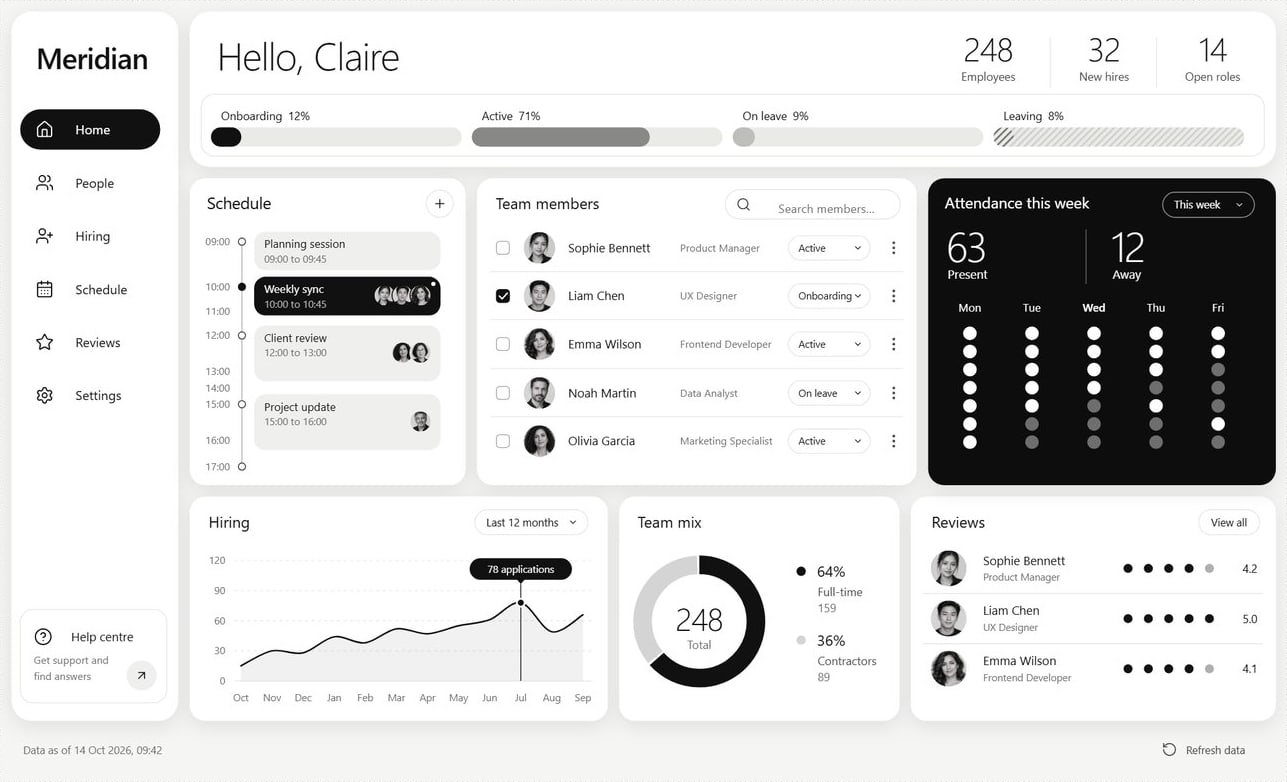
People
Teams · 8 tables · Portraits
Who is in, who is away, who is joining, and how reviews are going.
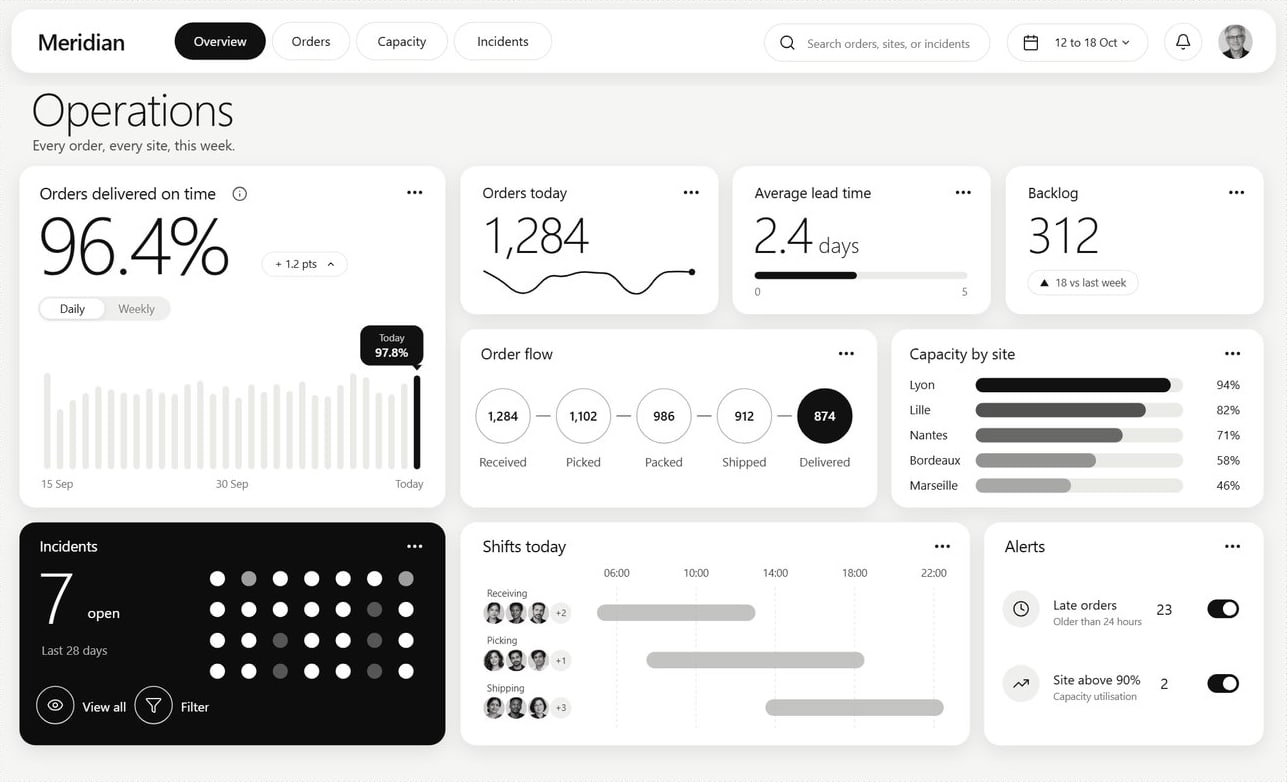
Operations
Operations · 6 tables · Portraits
Orders moving through each site today, capacity, late orders and who is on shift.
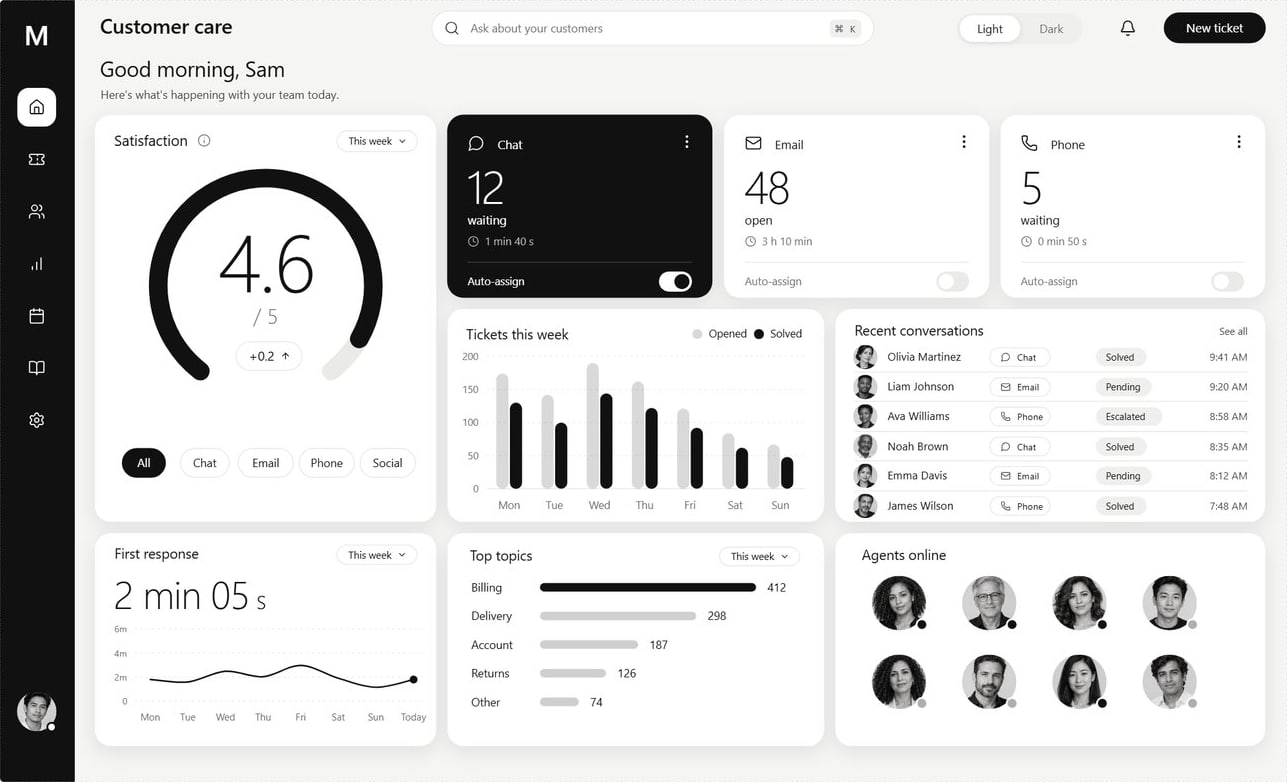
Customer care
Customers · 5 tables · Portraits
Tickets waiting in each channel, how fast the team answers and how customers rate it.
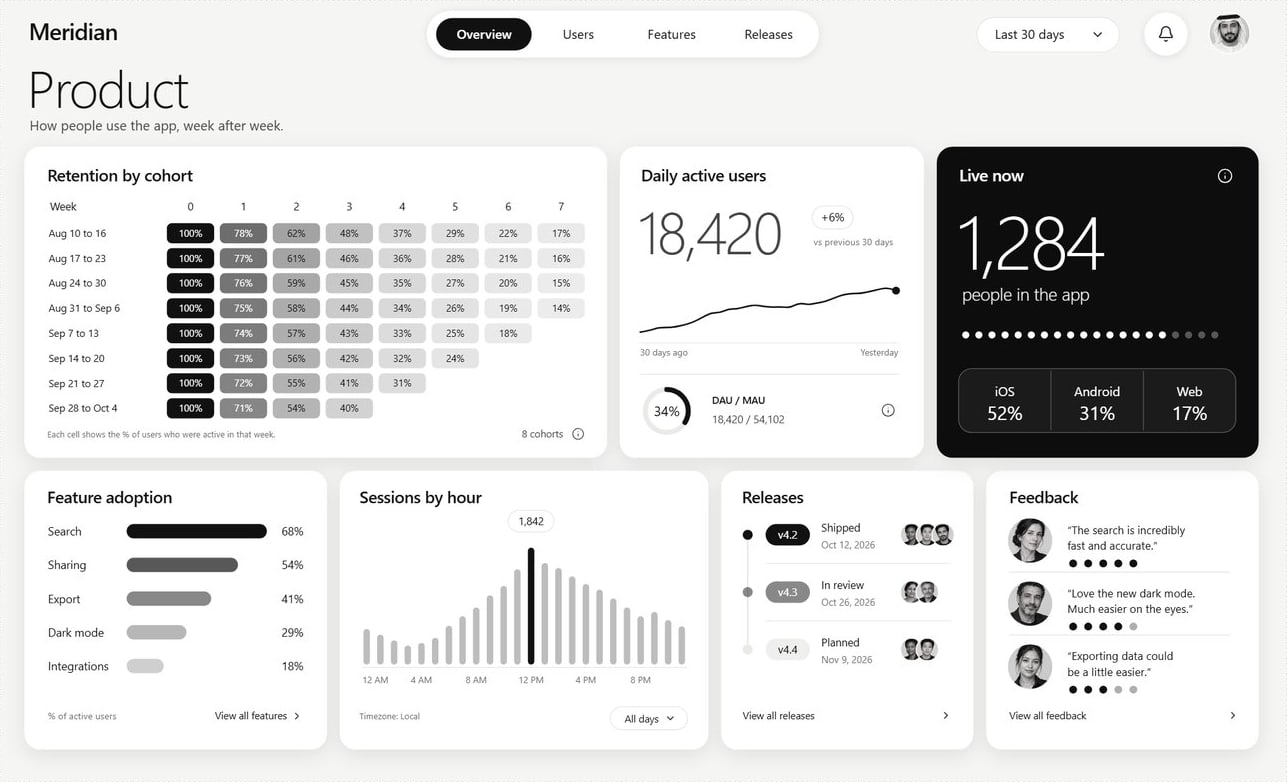
Product
Growth · 12 tables · Portraits
Active users by platform, retention by cohort, feature adoption and the next releases.
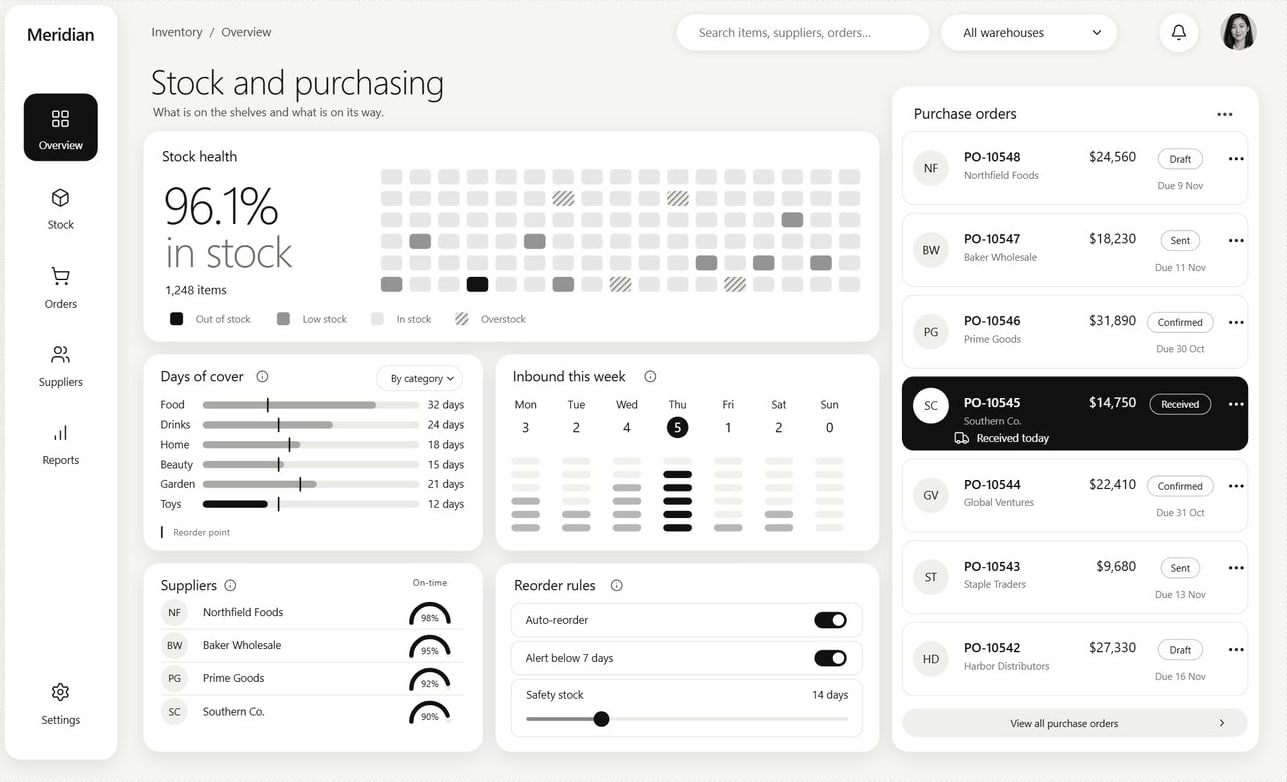
Stock and purchasing
Operations · 6 tables · Portraits
What is on the shelves, what runs low and which purchase orders are on their way.
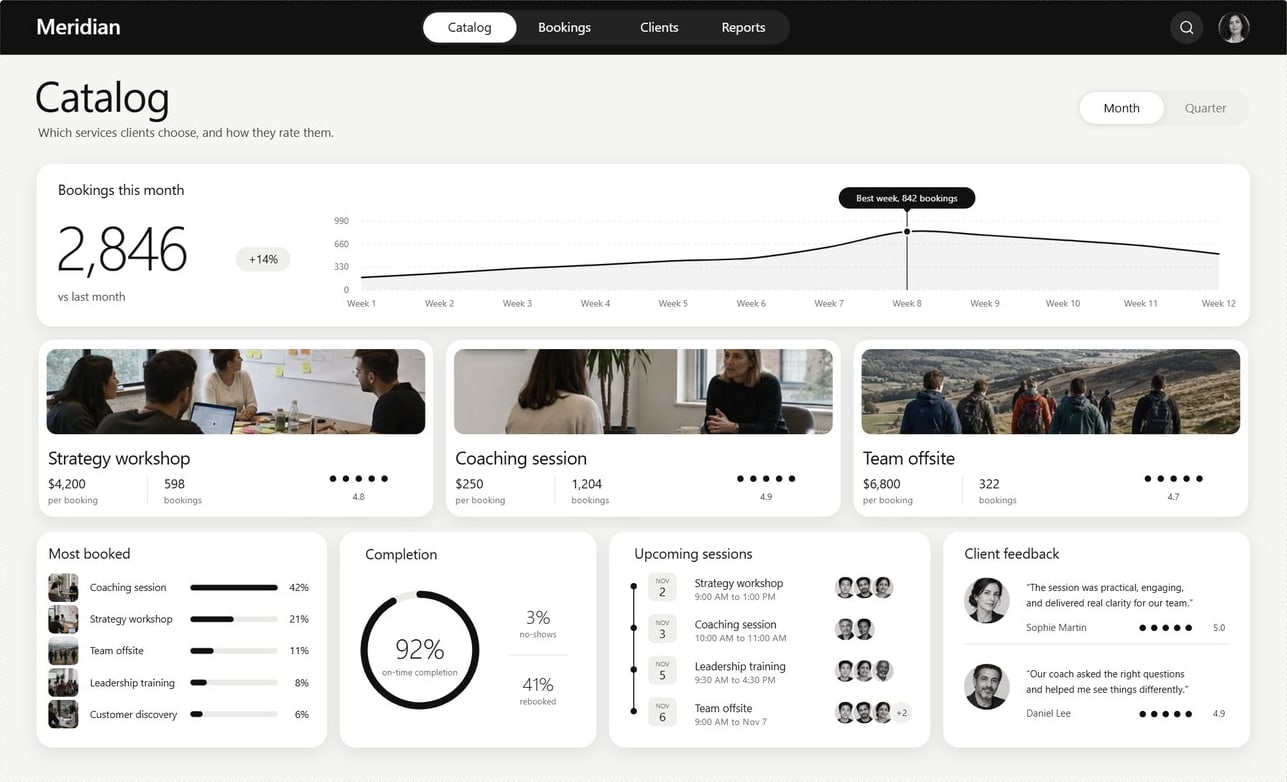
Services
Customers · 7 tables · 6 photos
Which services clients choose, how they book them and how they rate them.
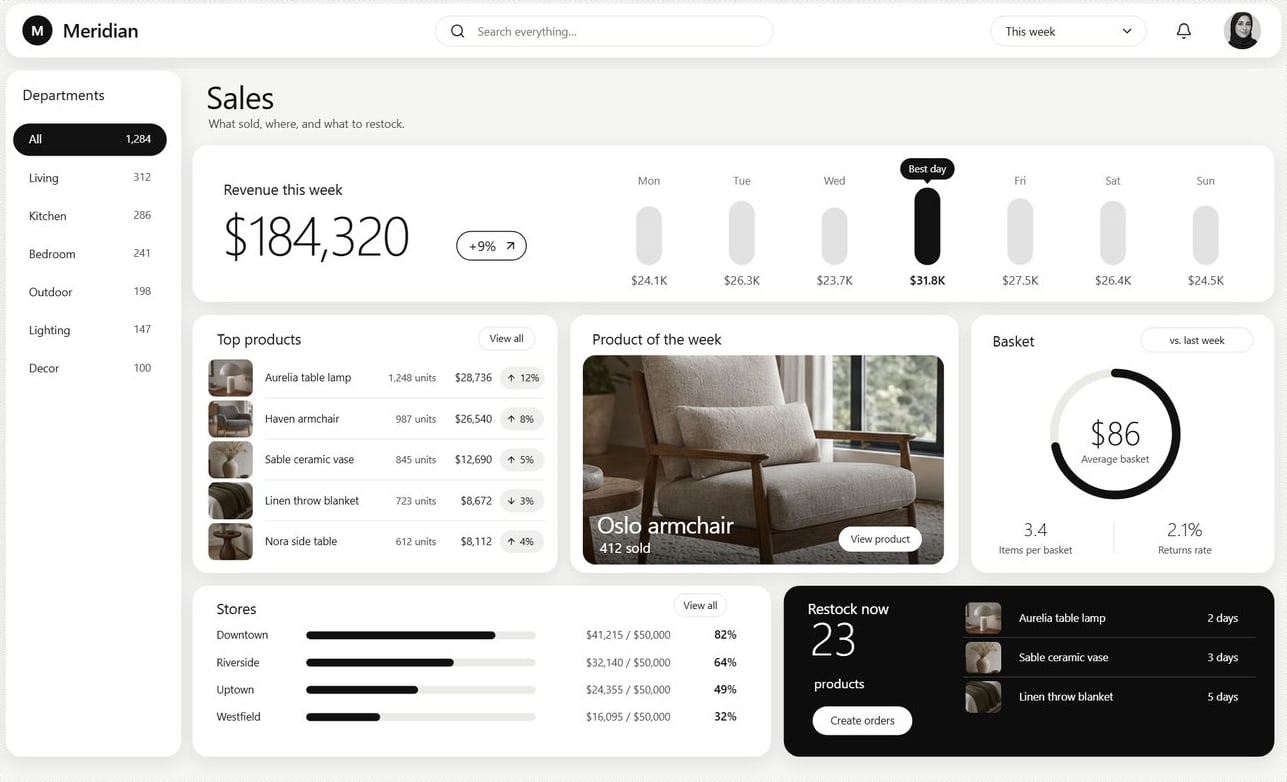
Sales
Commerce · 6 tables · 24 photos
Revenue this week by department and store, best sellers and what to restock.
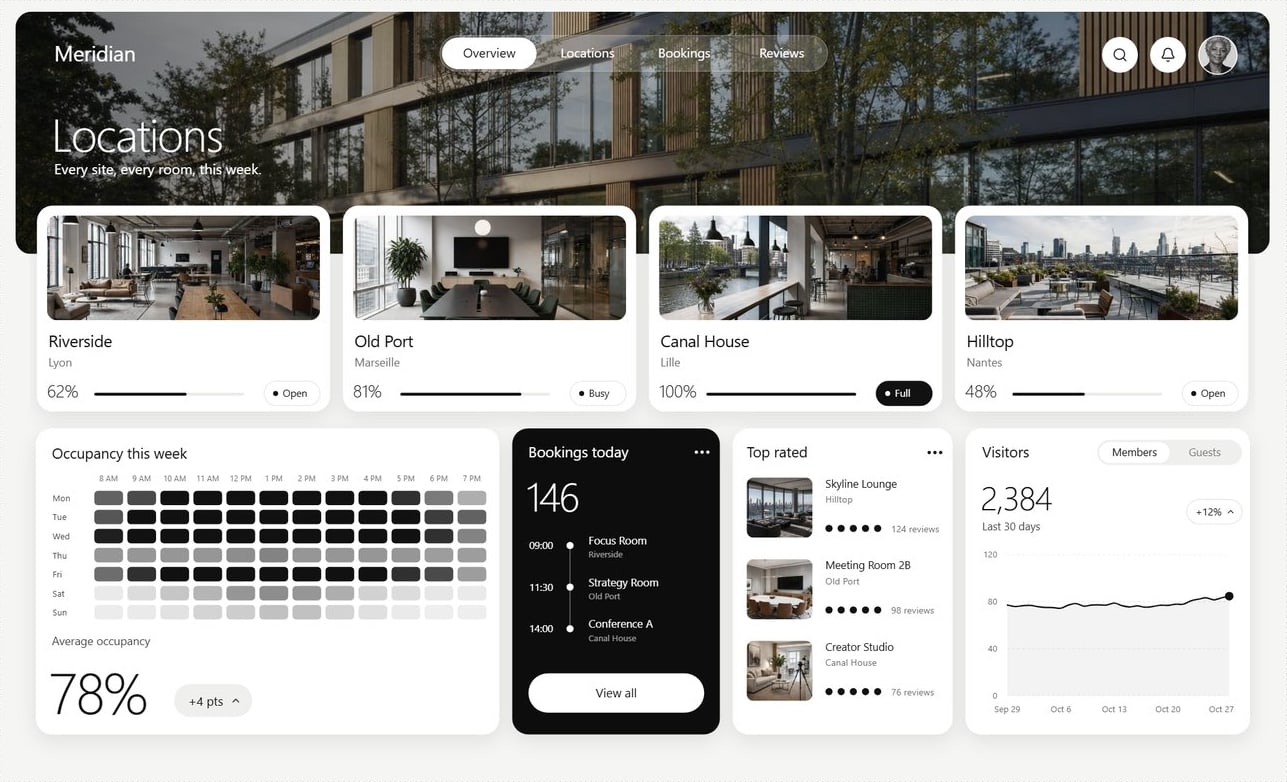
Locations
Operations · 6 tables · 17 photos
How full each location is today, the rooms people book and who comes in.
How it works
Your brand, a canvas,
your workbook.
- 01
Set your brand
Your logo, three colours, a font, and a style: Soft, Bold or Crisp. Every canvas you download carries it. Three brands per account.
- 02
Pick a canvas
Nine pages: marketing, people, operations, customer care, product, stock, services, sales and locations. The zip holds a Power BI project with sample data, a workbook and a Read me.
- 03
Point it at your data
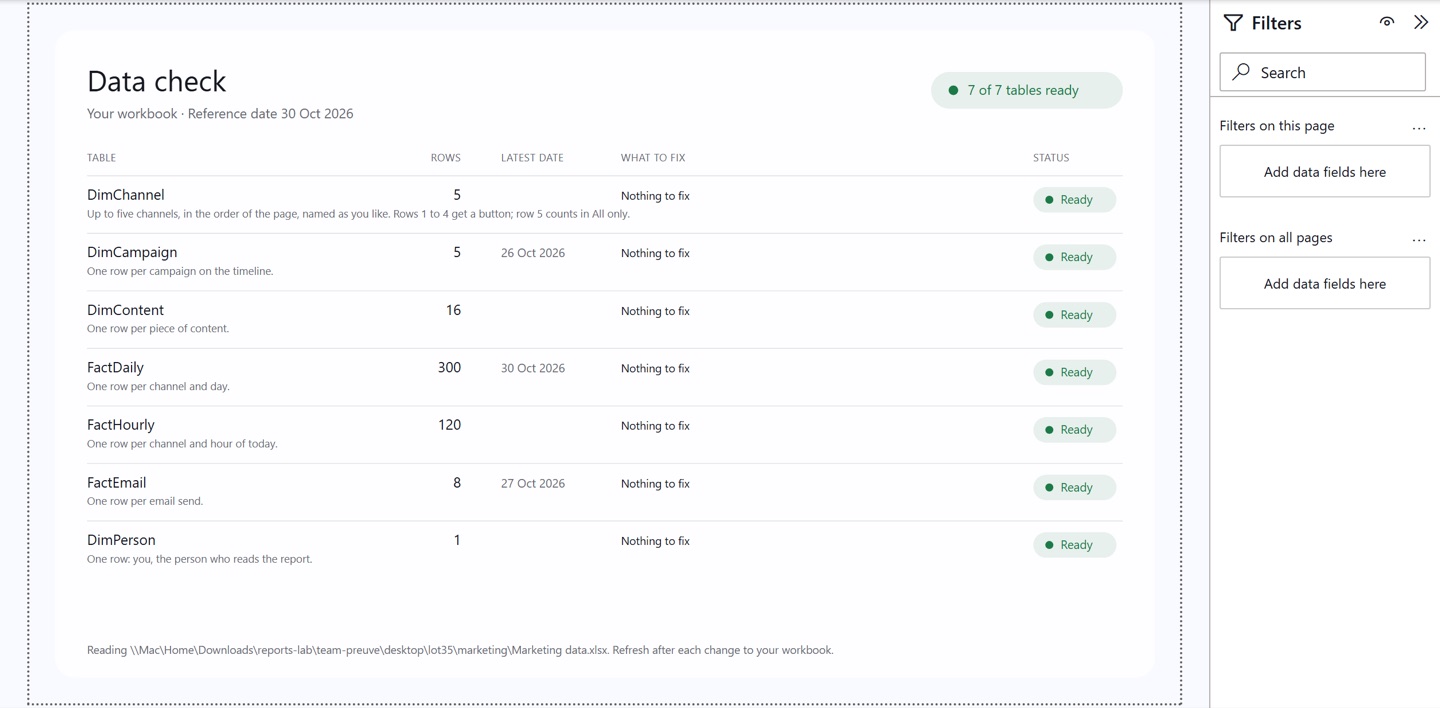
Fill the workbook, one sheet per table. In Desktop, two parameters and a refresh. A Data check page tells you what to fix, in plain words, until every table reads Ready.
The betaOpen
What the beta is, said plainly.
We are opening Team to a handful of teams and watching how they get on. Here is the deal.
Free while in beta
No tokens, no card. Team plans come later, and beta members hear first.
Power BI Desktop, on Windows
The report is a .pbip project. It opens in Power BI Desktop, free from Microsoft, not in a browser and not on a Mac.
Your numbers in an Excel workbook
Each canvas expects a few sheets with fixed headers. The Read me and the Data check page walk you through them.
We watch, and we fix
Tell us where you got stuck, from the Get started tab or the Tell us button. What blocks you this week gets fixed next week.
Questions
Before you join, the answers.
This week
Your first canvas,
in your brand, today.
A free account, a brand, a download. Then tell us how the workbook went: that is what the beta is for.