

Free reports
Atelier Nord: a free Power BI report for an architecture studio
Download Atelier Nord, a free Power BI report for an architecture studio: a Gantt you can click, hover and drill into, Light and Dark mode, no custom visuals.
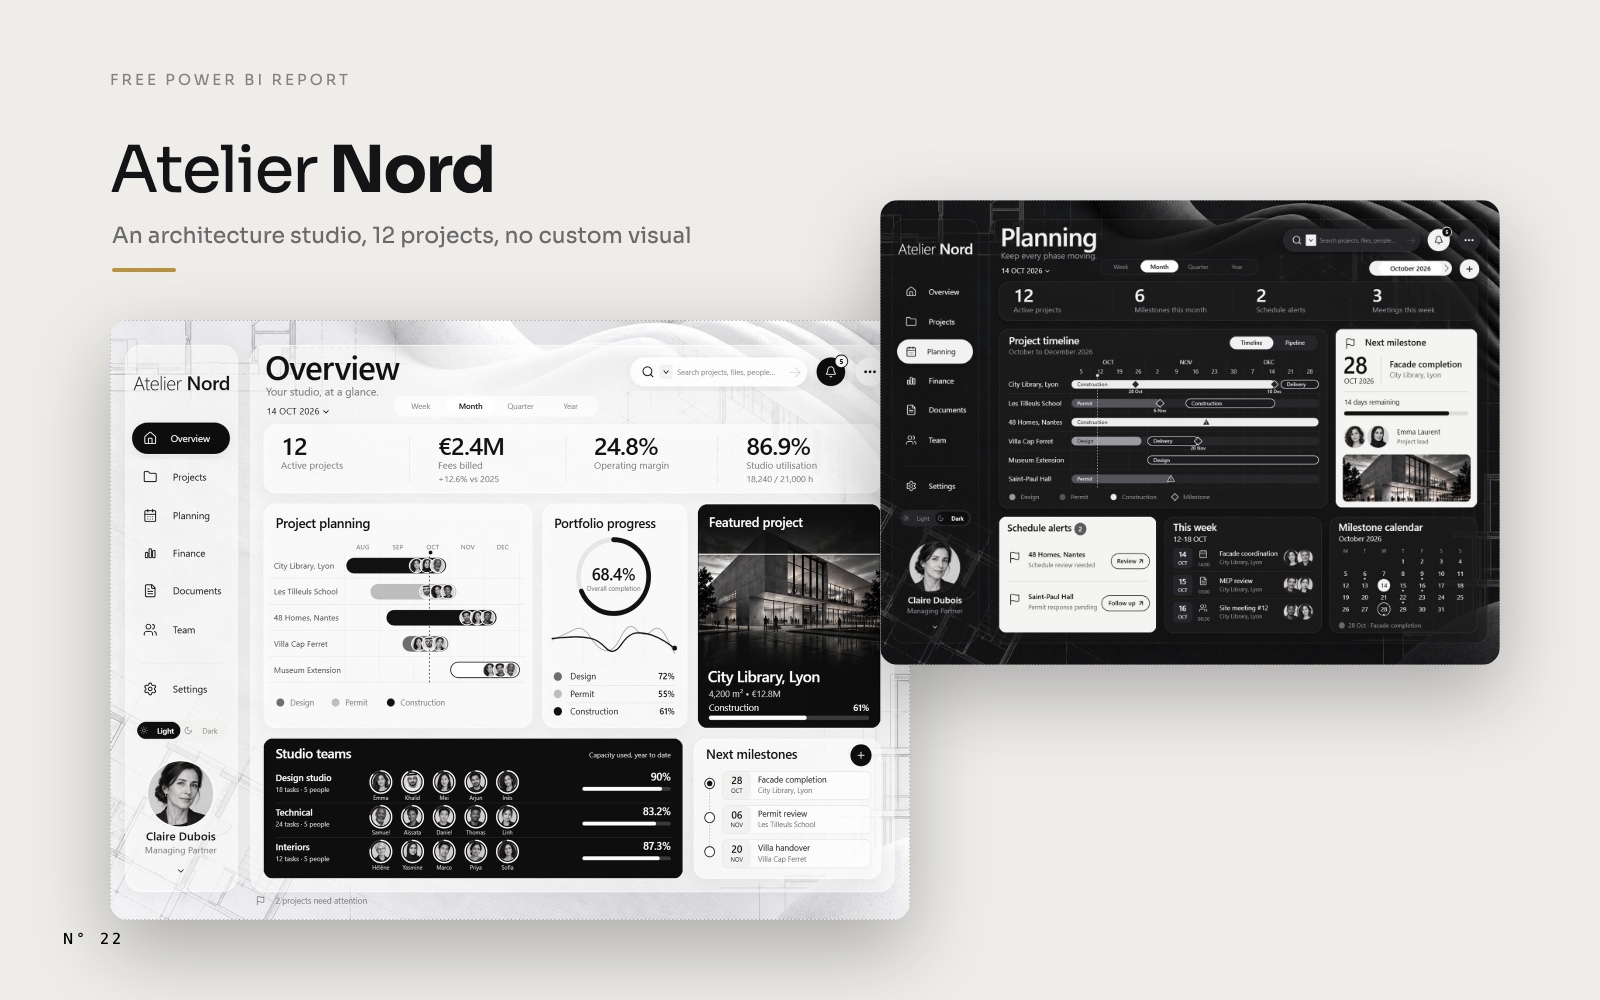
Atelier Nord is a Power BI report for an architecture studio in Lyon. It answers the questions a partner asks on Monday morning: which project is late, which one is eating more hours than planned, what is due this week, who is waiting for an invoice.
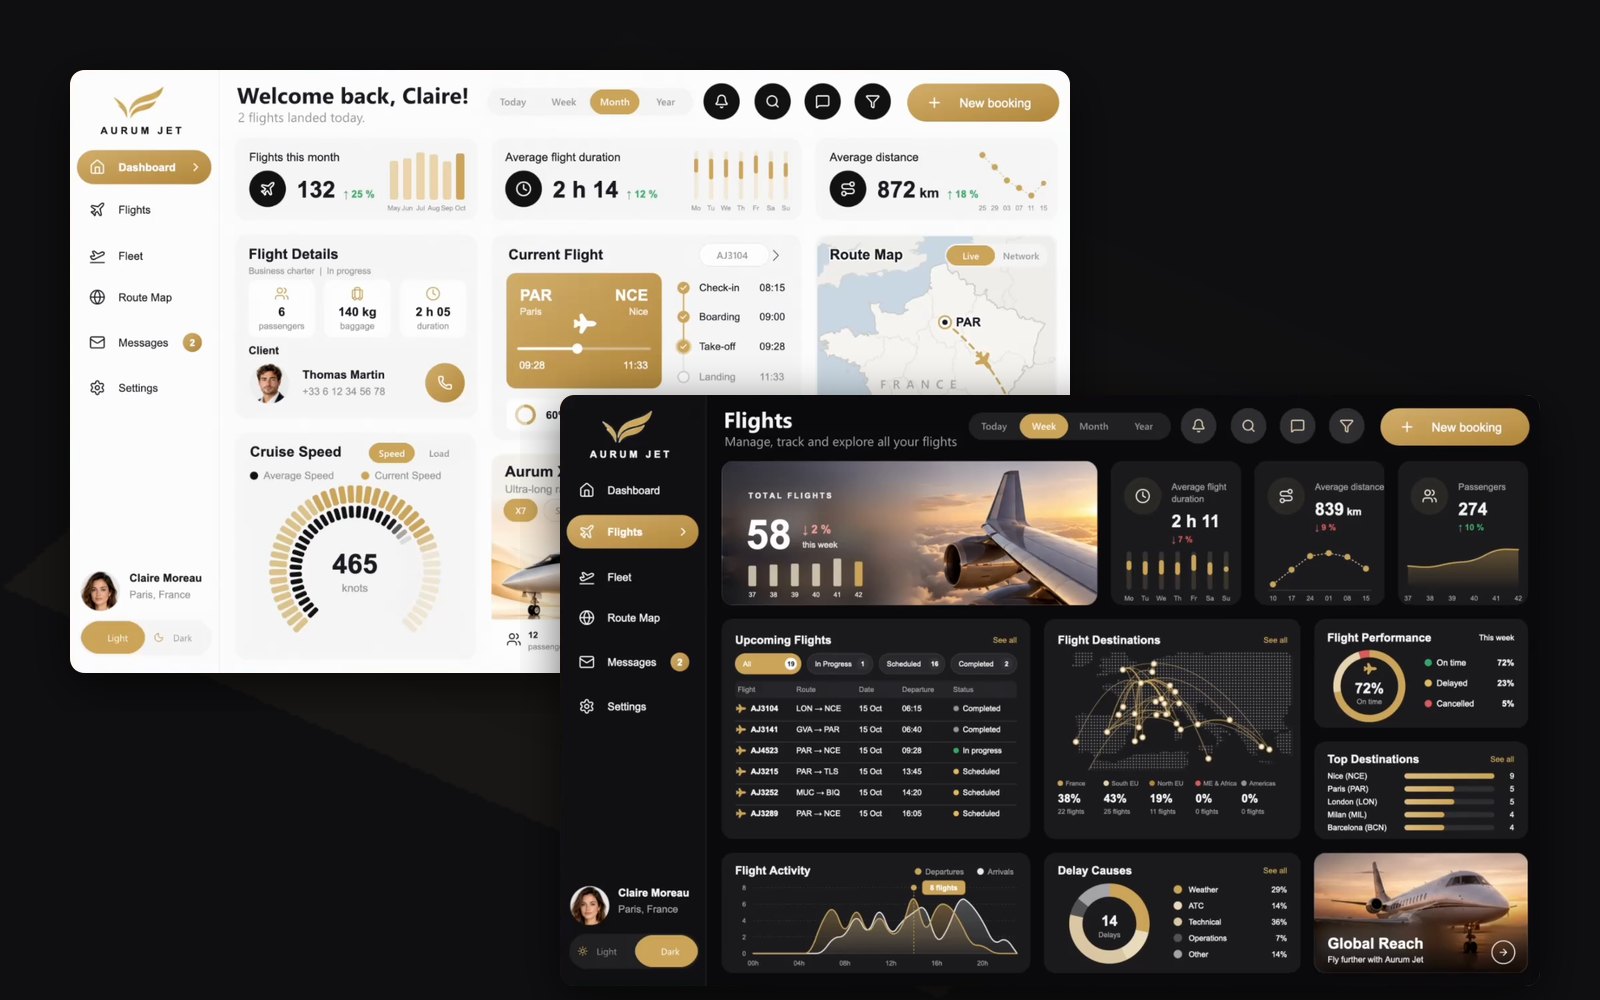
It is the successor of Aurum Jet, and it goes one step further. Aurum Jet drew everything with SVG measures, and we had to admit a limit: a drawing is an image, you can't hover it or click it. In Atelier Nord, the drawings are rows. Click a project in the planning and the page follows it. Hover it and a project card shows up. Right-click it and a full page opens on that project.
It is free, with no custom visual, and you can download it.
What Atelier Nord is
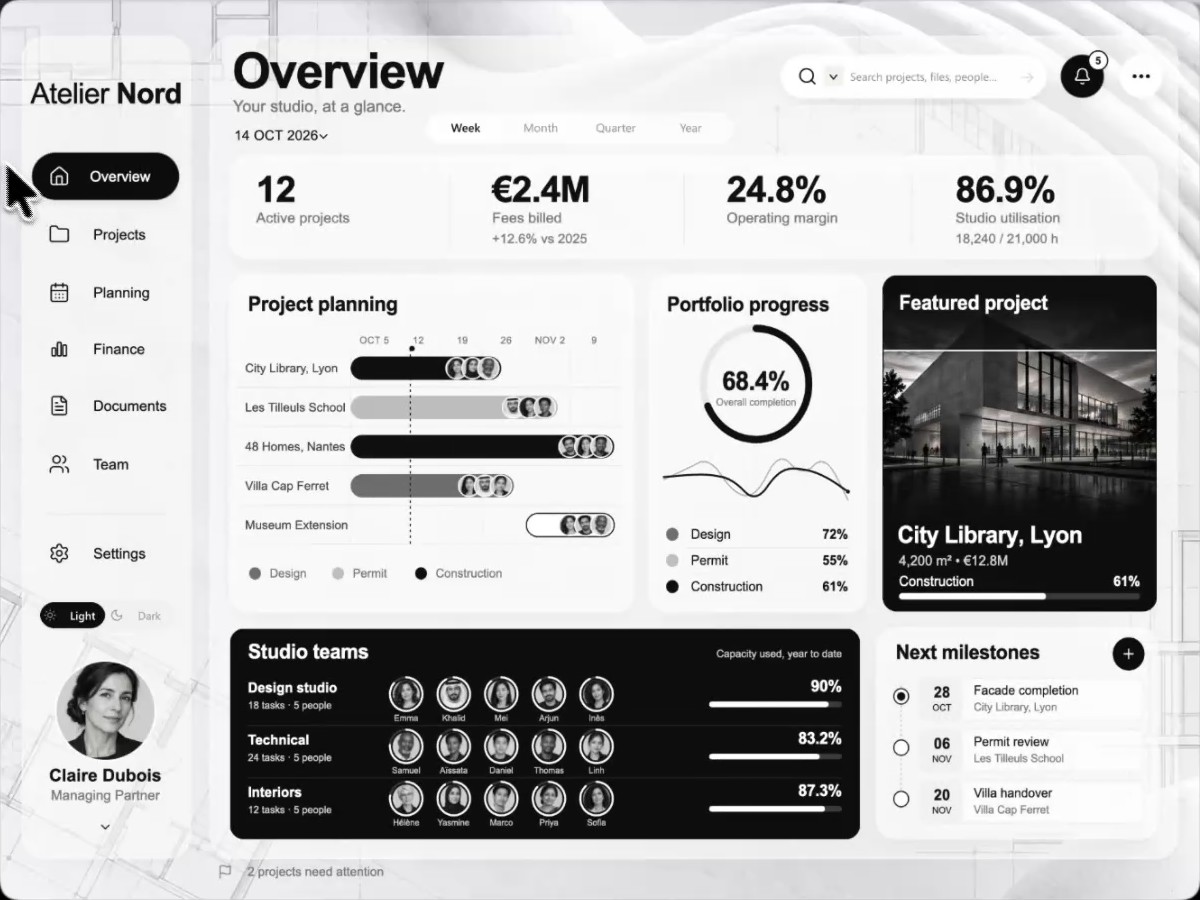
Atelier Nord is a fictional architecture studio, based in Lyon, with 12 projects in progress across France: a library, a school, housing, a villa, a museum extension, offices, a hotel. The studio, its clients and every number are made up. The data was generated, then calibrated so that each figure matches the mockups the report was designed from.
- 4 report pages: Overview, Projects, Planning, Finance.
- A project page that opens from any project, and a project card that shows on hover.
- Notifications from the bell, and a New milestone panel.
- Light and Dark mode, switched from the sidebar.
- 136 visuals, 0 custom visuals: 55 buttons, 47 cards, 19 slicers, 10 images and 5 tables.
- A semantic model of 31 tables, 24 relationships and 192 measures.
- 19 projects (12 in progress), 24 people, 39,328 timesheet lines, 249 invoices, 74 milestones.
What's in the zip
The zip weighs 1.7 MB. It holds the project as Power BI Desktop opens it, in the PBIP format, minus the caches.
| Path | What it is |
|---|---|
AtelierNord.pbip | The file you open in Power BI Desktop |
AtelierNord.Report/ | The report in PBIR format: one JSON file per page and per visual, the theme and the bookmarks |
AtelierNord.SemanticModel/ | The model in TMDL format: 31 tables, 24 relationships, 192 measures |
data/ | 17 Parquet files: projects, phases, work packages, people, teams, capacity, timesheets, planned hours, tasks, invoices, costs, milestones, meetings, alerts |
LICENSES/ | lucide.txt, the licence of the icons |
README.md | How to open it, in English and in French |
The building renders, the portraits and the Dark mode background live inside the model, as images split into text chunks, so there is no separate image folder to keep next to the report.
How to open it, step by step
You need Power BI Desktop for Windows, a 2026 release. On a Mac, run Desktop in a Windows virtual machine.
- Download the zip from the Atelier Nord page or from the GitHub release.
- Unzip it at the root of
C:\. The zip holds anAtelierNordfolder, so the data lands inC:\AtelierNord\data\, the path the model expects. - Open
AtelierNord.pbipin Power BI Desktop. - Unzipped somewhere else? Go to Transform data > Edit parameters and set
DossierDonneesto the full path of thedatafolder, ending with a backslash, for exampleD:\Projects\AtelierNord\data\. - Click Refresh. The data is small, it loads in seconds.
Three things to know once it is open:
- The report opens on the Overview, in Light mode, with the timescale set to Month.
- The report's "now" is fixed at 14 October 2026, 09:42. "Today", "this week" and every "year to date" are computed from that moment, so the numbers never drift.
- In Desktop, hold Ctrl and click to use a button: the menu, Open project, Grid and List, the bell, the + of Next milestones. Once published, a plain click works.
A tour of the report
Overview
Four KPIs count up from zero when the page opens: 12 active projects, €2.4M of fees billed this year (+12.6 % on 2025), a 24.8 % operating margin and 86.9 % of the studio's hours used. Below: the project planning, the portfolio progress with its hours curve, the featured project, the three studio teams with their capacity, and the next milestones.
The planning is the heart of the report. Click a project: the featured project and the studio teams switch to it. Hover it: the project card shows its render, its phase, its budget, its hours, its next milestone and its team.
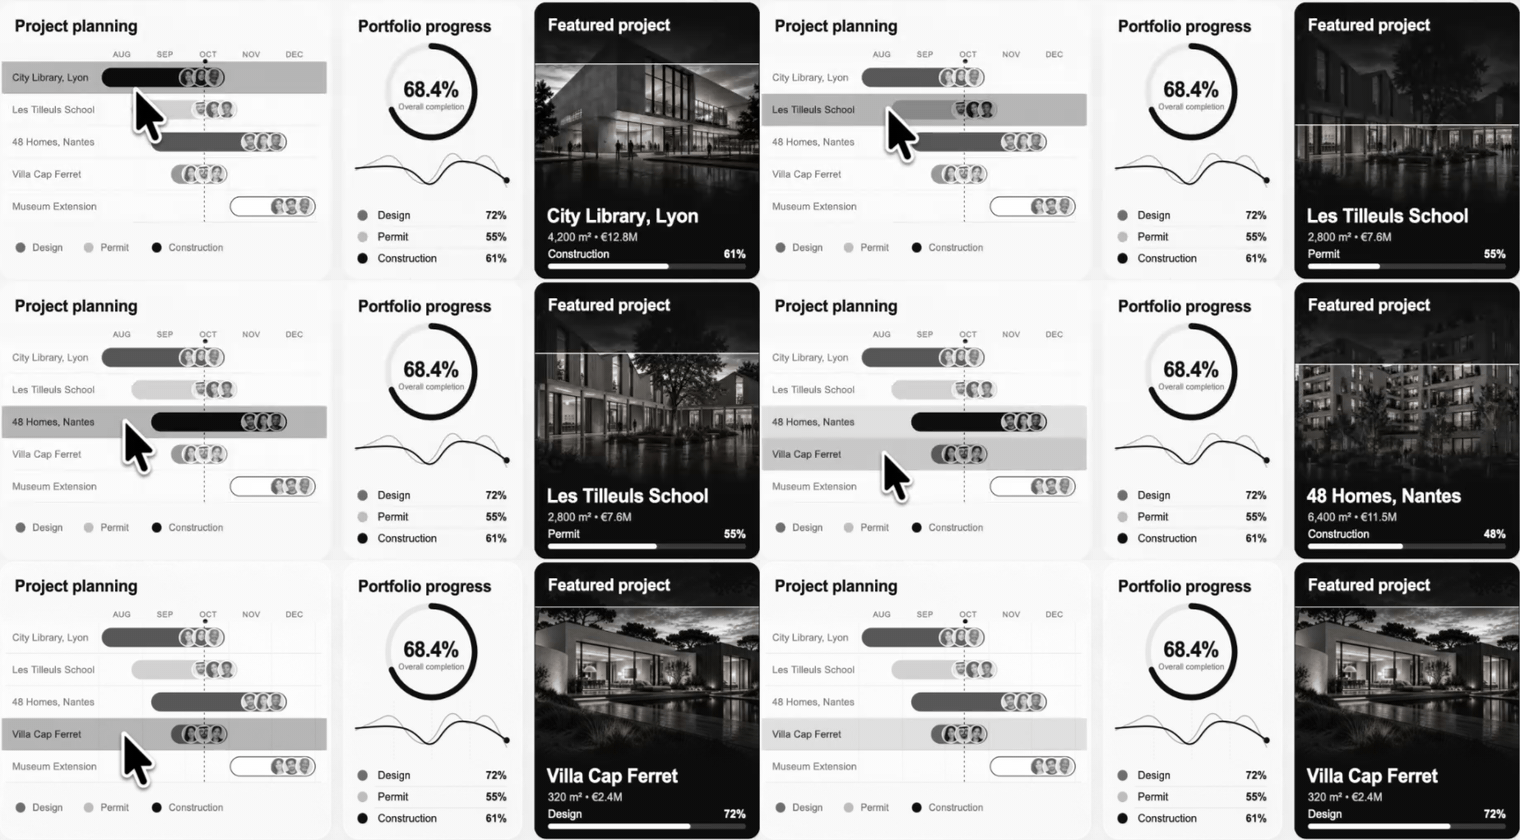
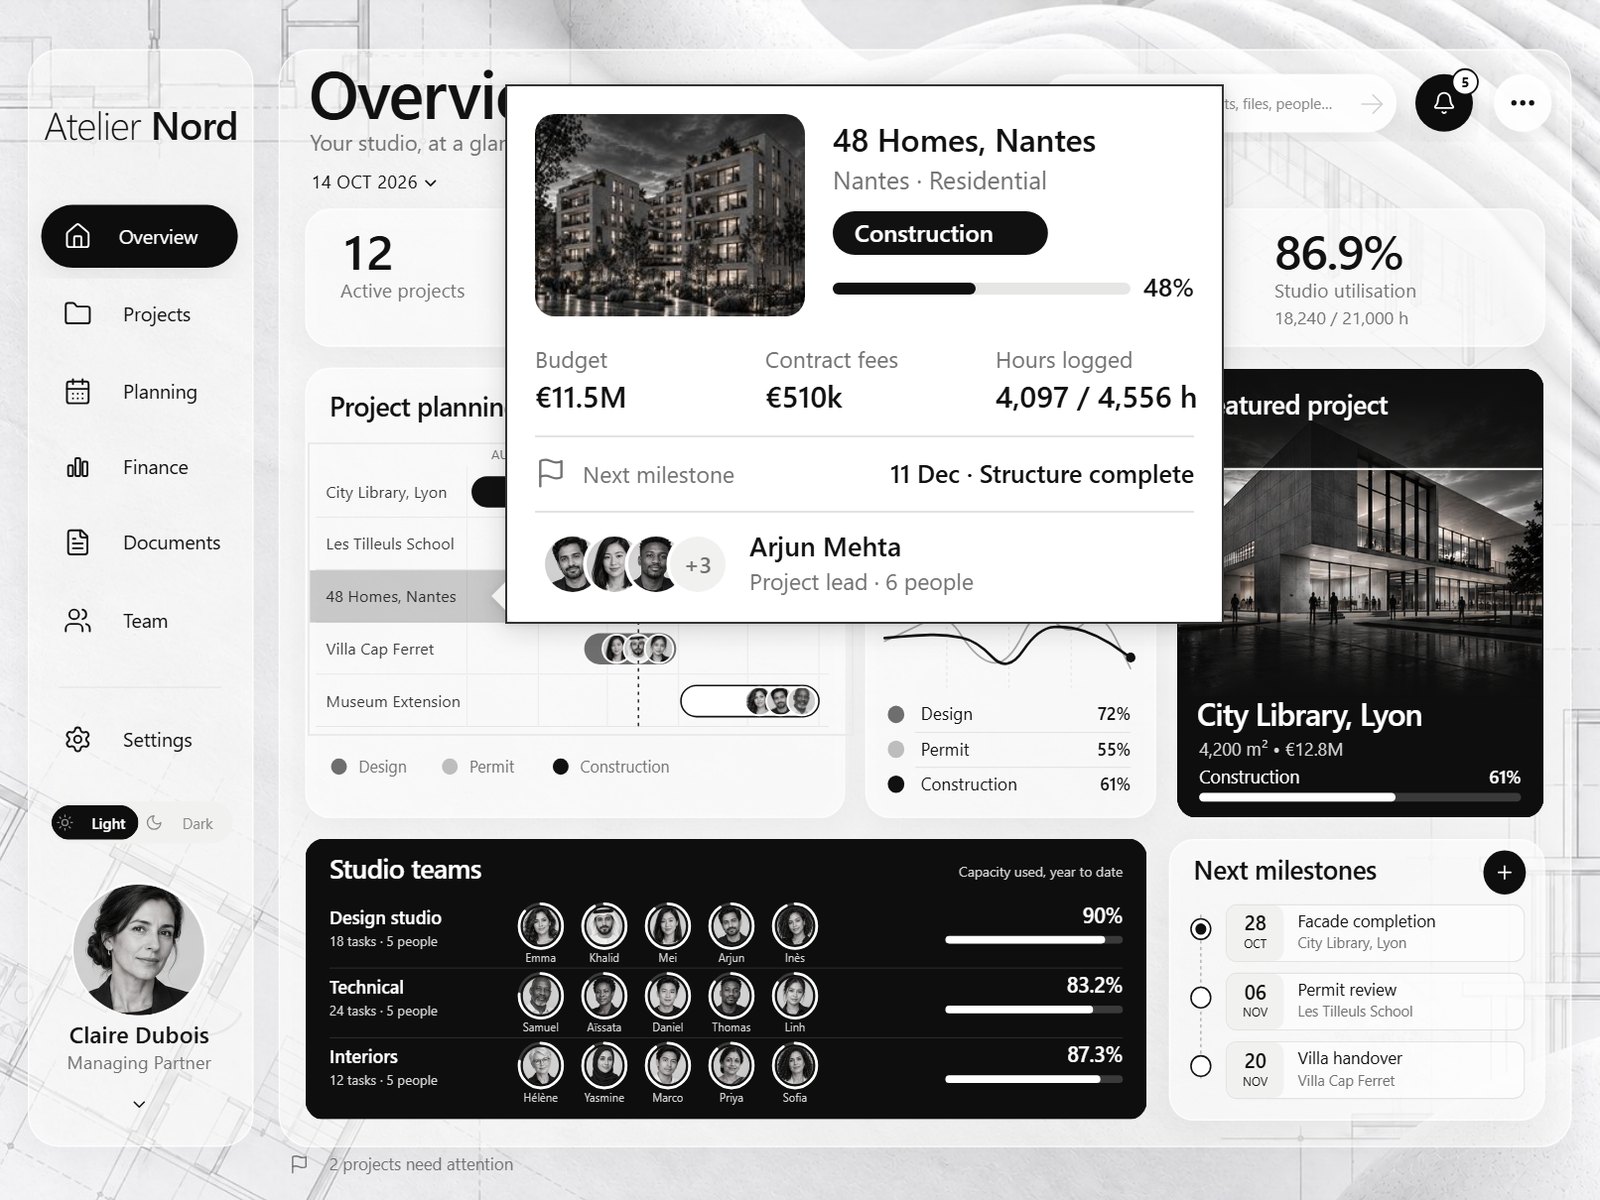
How the planning is built, with its axis, its hover card and its drill-through: a Power BI Gantt chart you can click, hover and drill into.
Projects
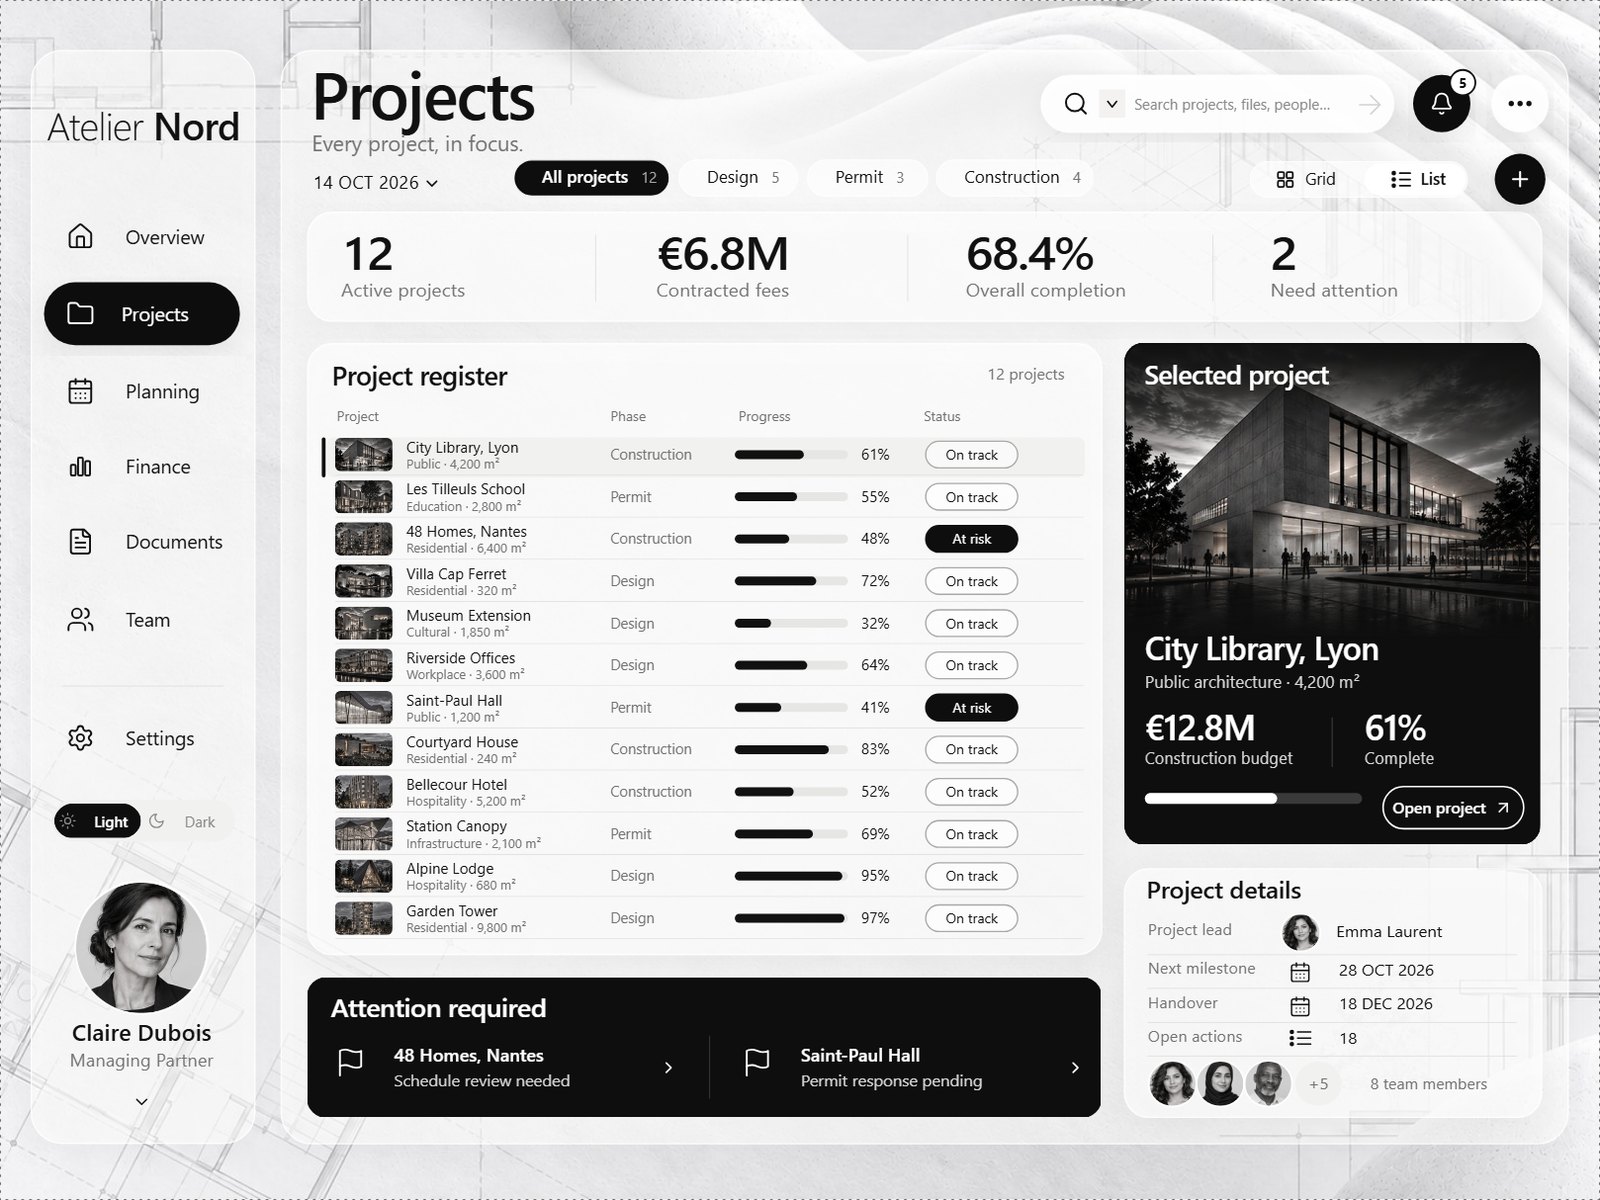
The project register, in List or Grid. Phase chips with their counts filter it (All projects, Design, Permit, Construction), and the list has two pages. Select a project and the right side shows its render, its budget, its progress, its details and its team, with an Open project button. Attention required lists the projects at risk.
Planning
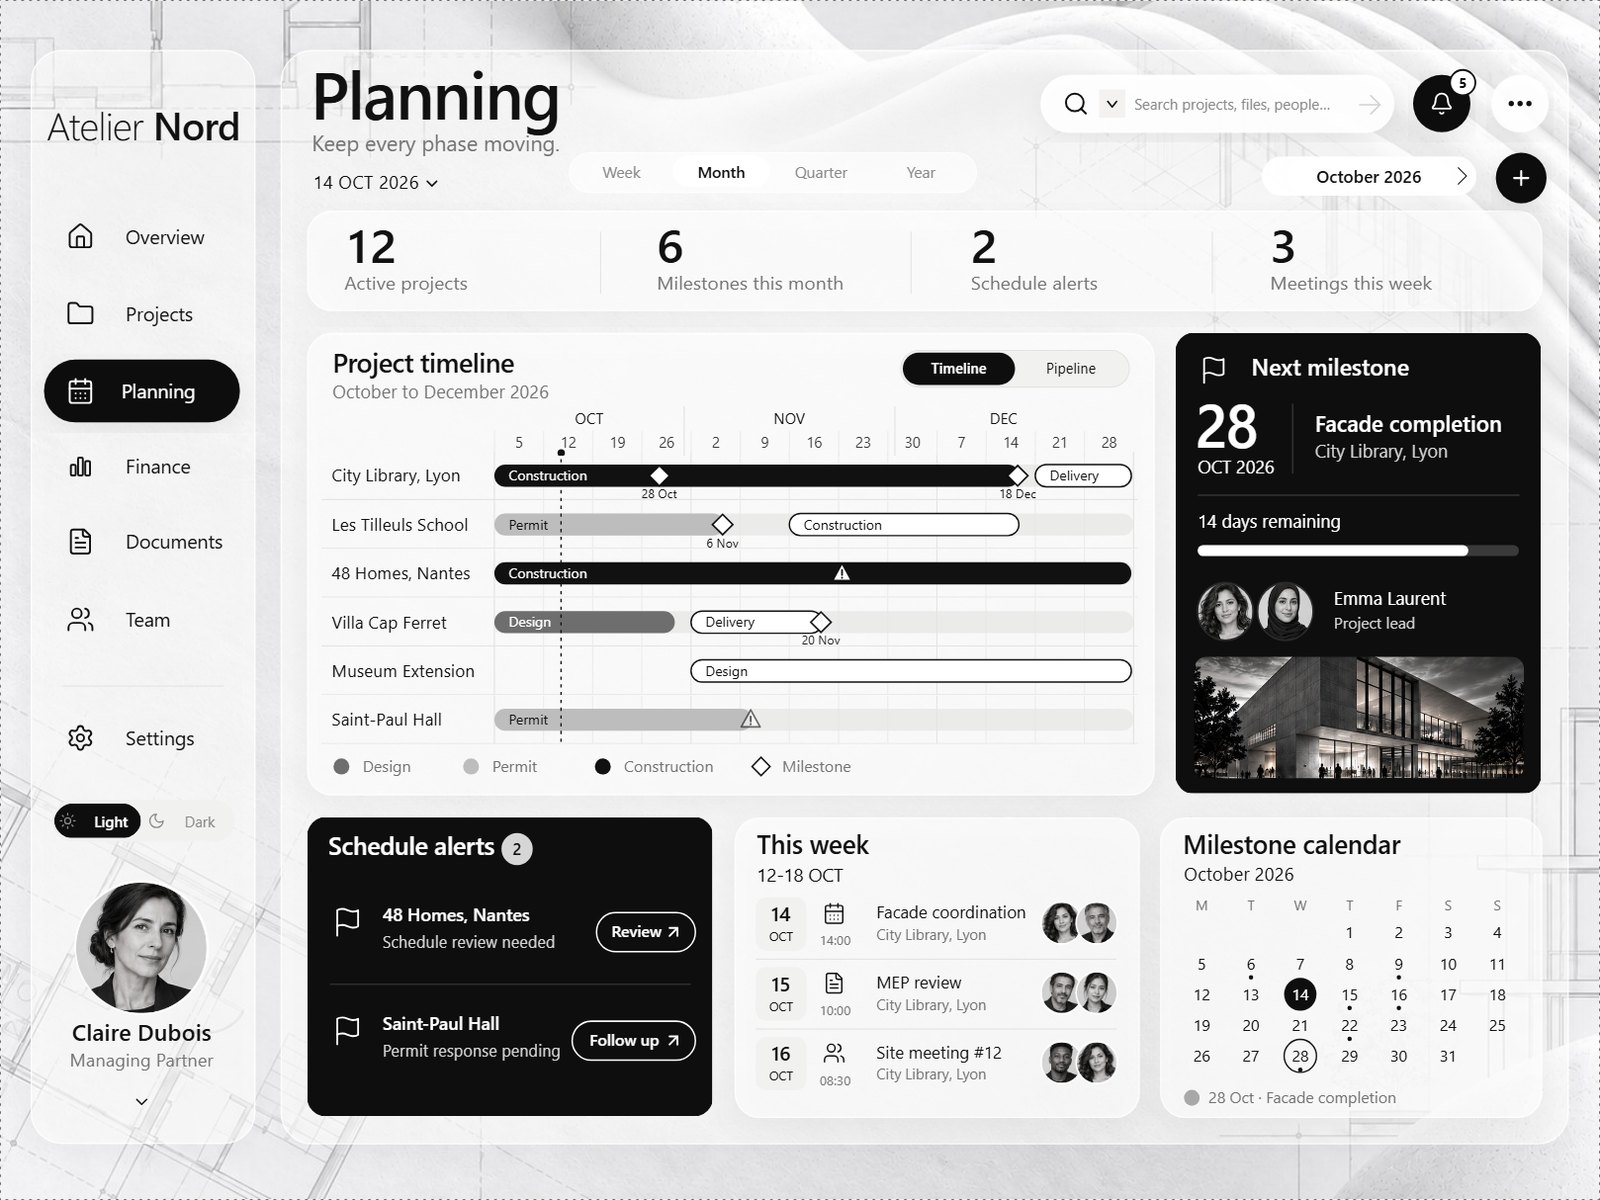
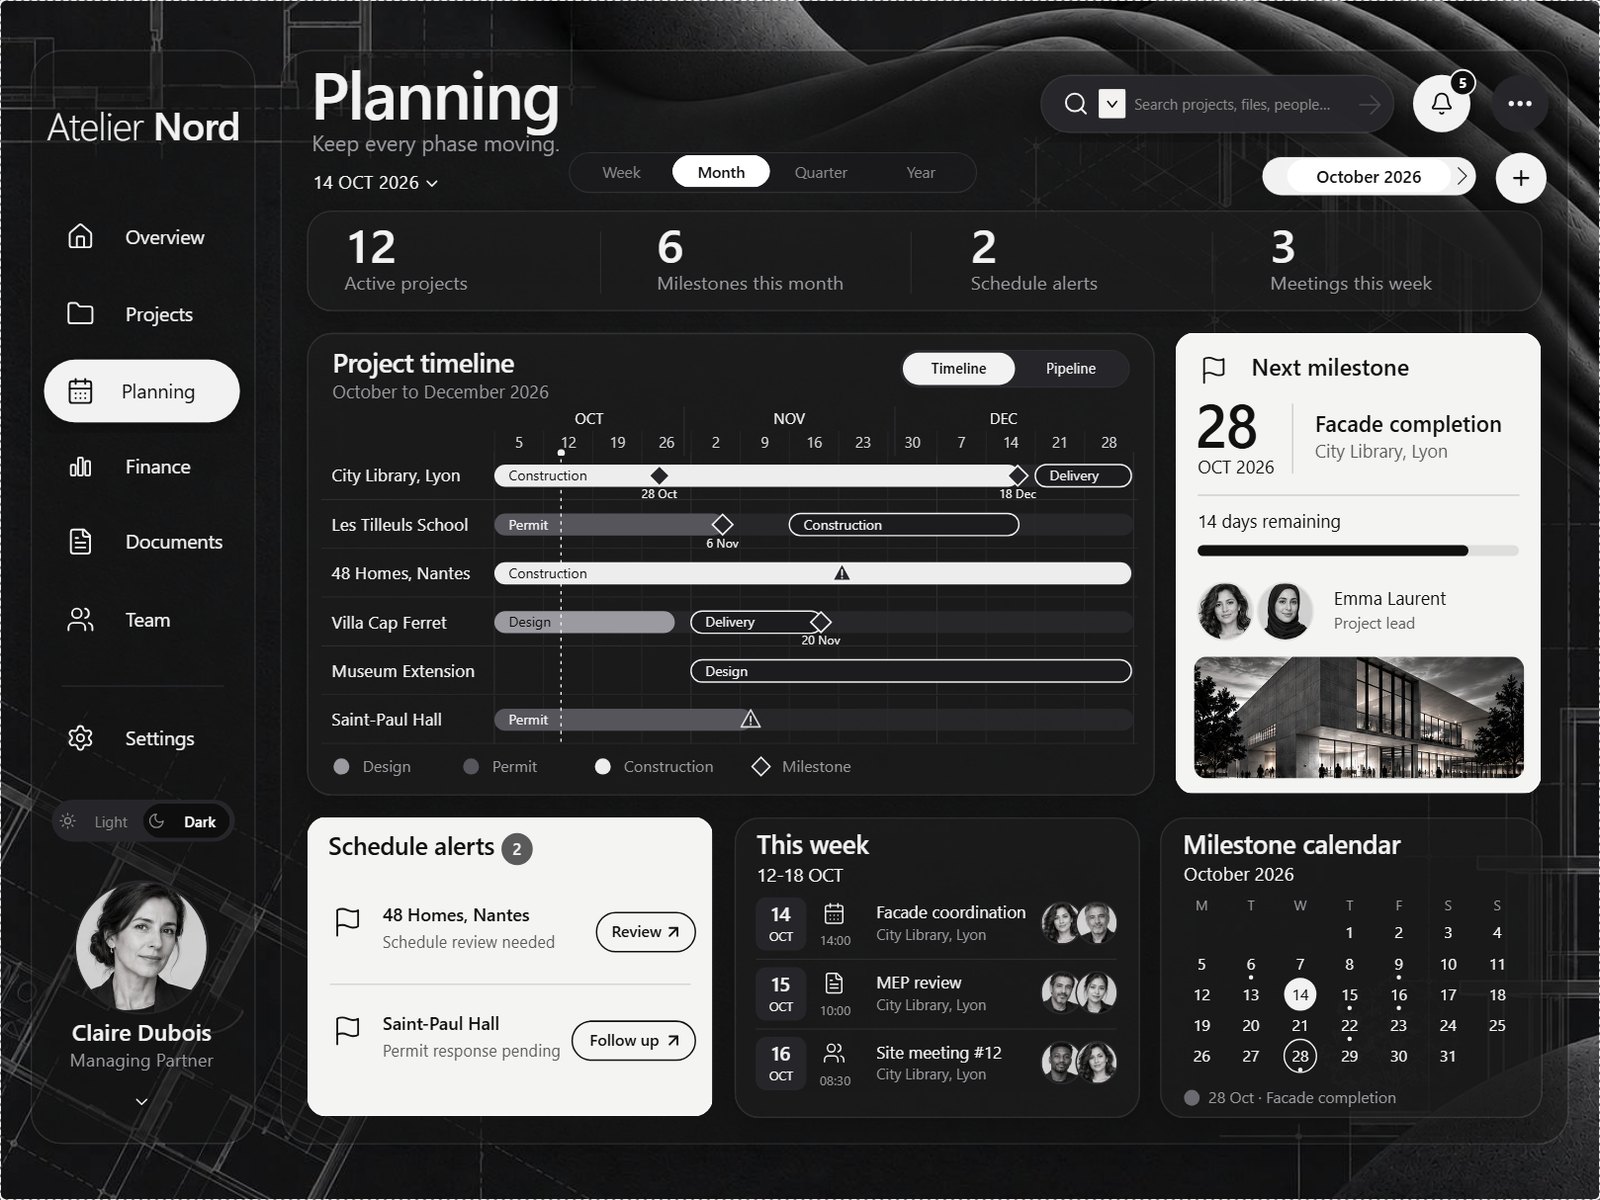
A weekly timeline from October to December, with every phase, the milestones as diamonds and the alerts as triangles. A month picker moves the calendar. Around it: the next milestone with its countdown, the schedule alerts, this week's meetings with their attendees, and a milestone calendar. One toggle switches the timeline to a pipeline of the 12 projects, phase by phase.
Finance
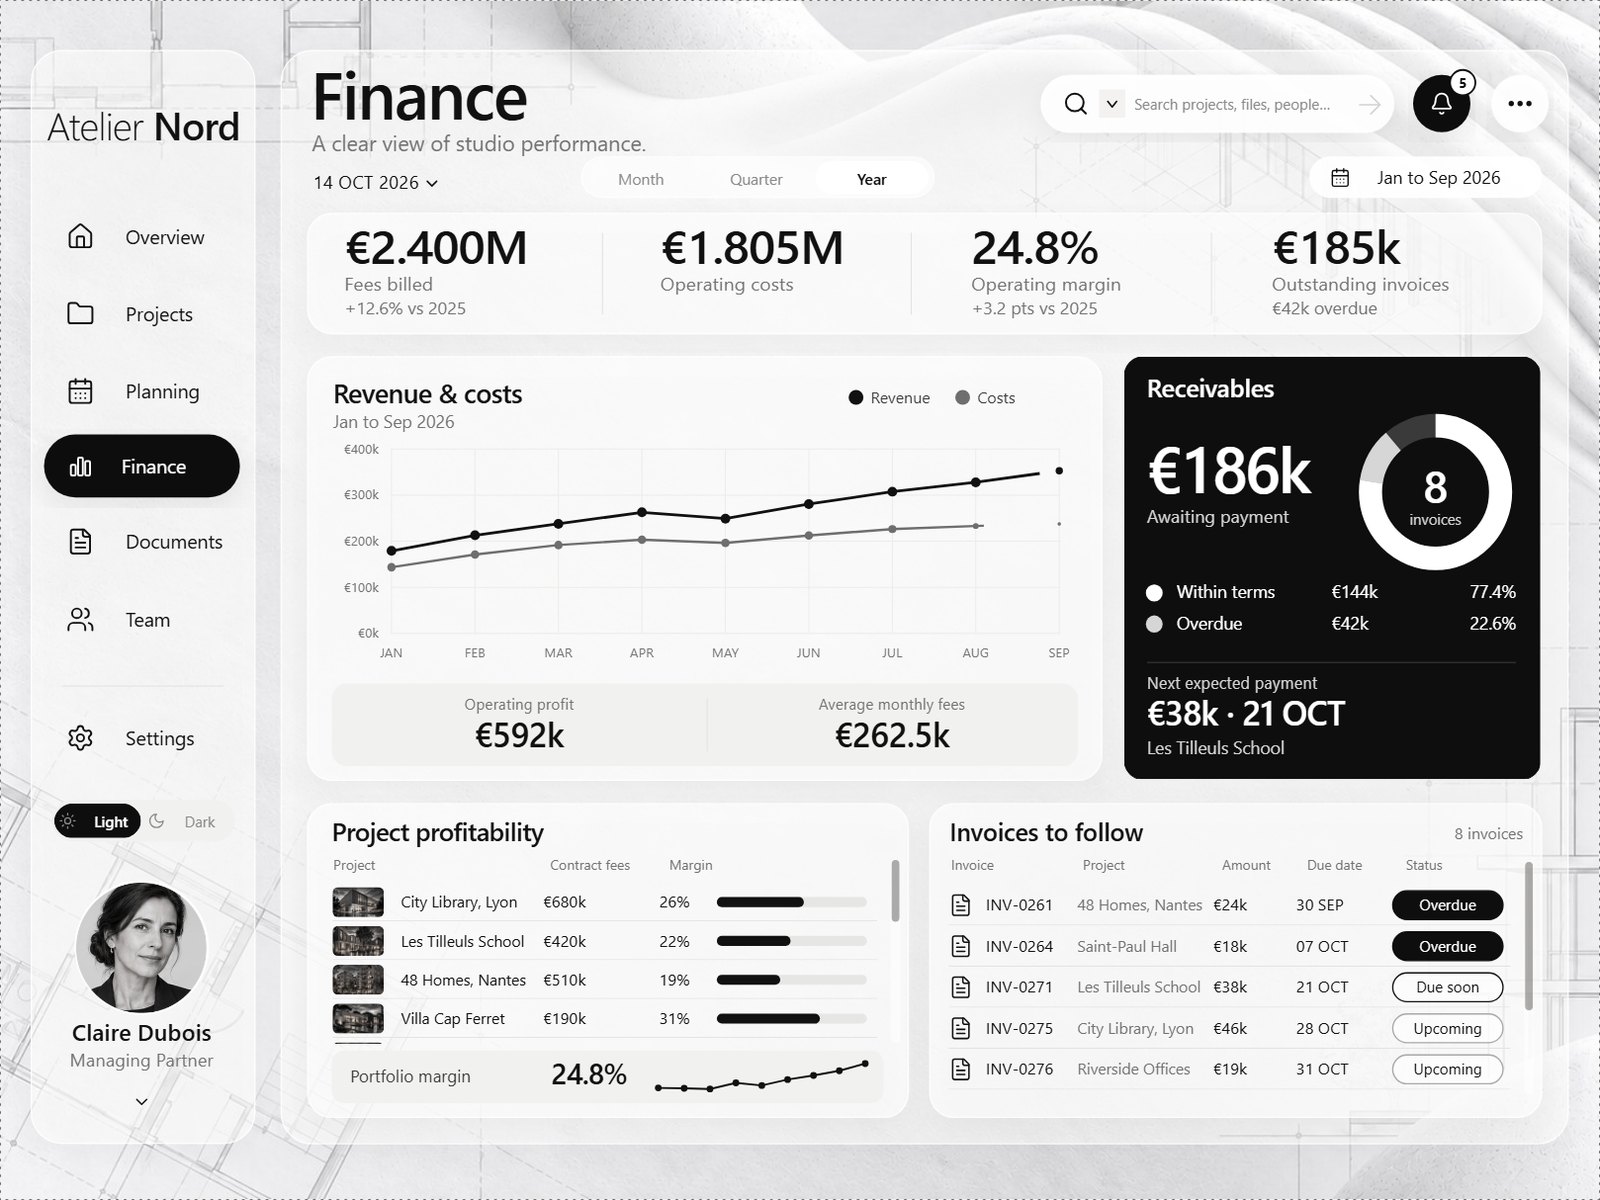
Fees billed, operating costs, operating margin and outstanding invoices, by month, quarter or year, against the year before. Revenue and costs month by month, the receivables split between within terms and overdue, the profitability of each project and the invoices to follow up.
The project page
Right-click any project, in any table, then Drill through > Project. The page opens on that project: the building rising to the share of its phase that is done, the hours logged against the plan from first sketch to handover, the phases, the project details, and the map of France with the project's city.
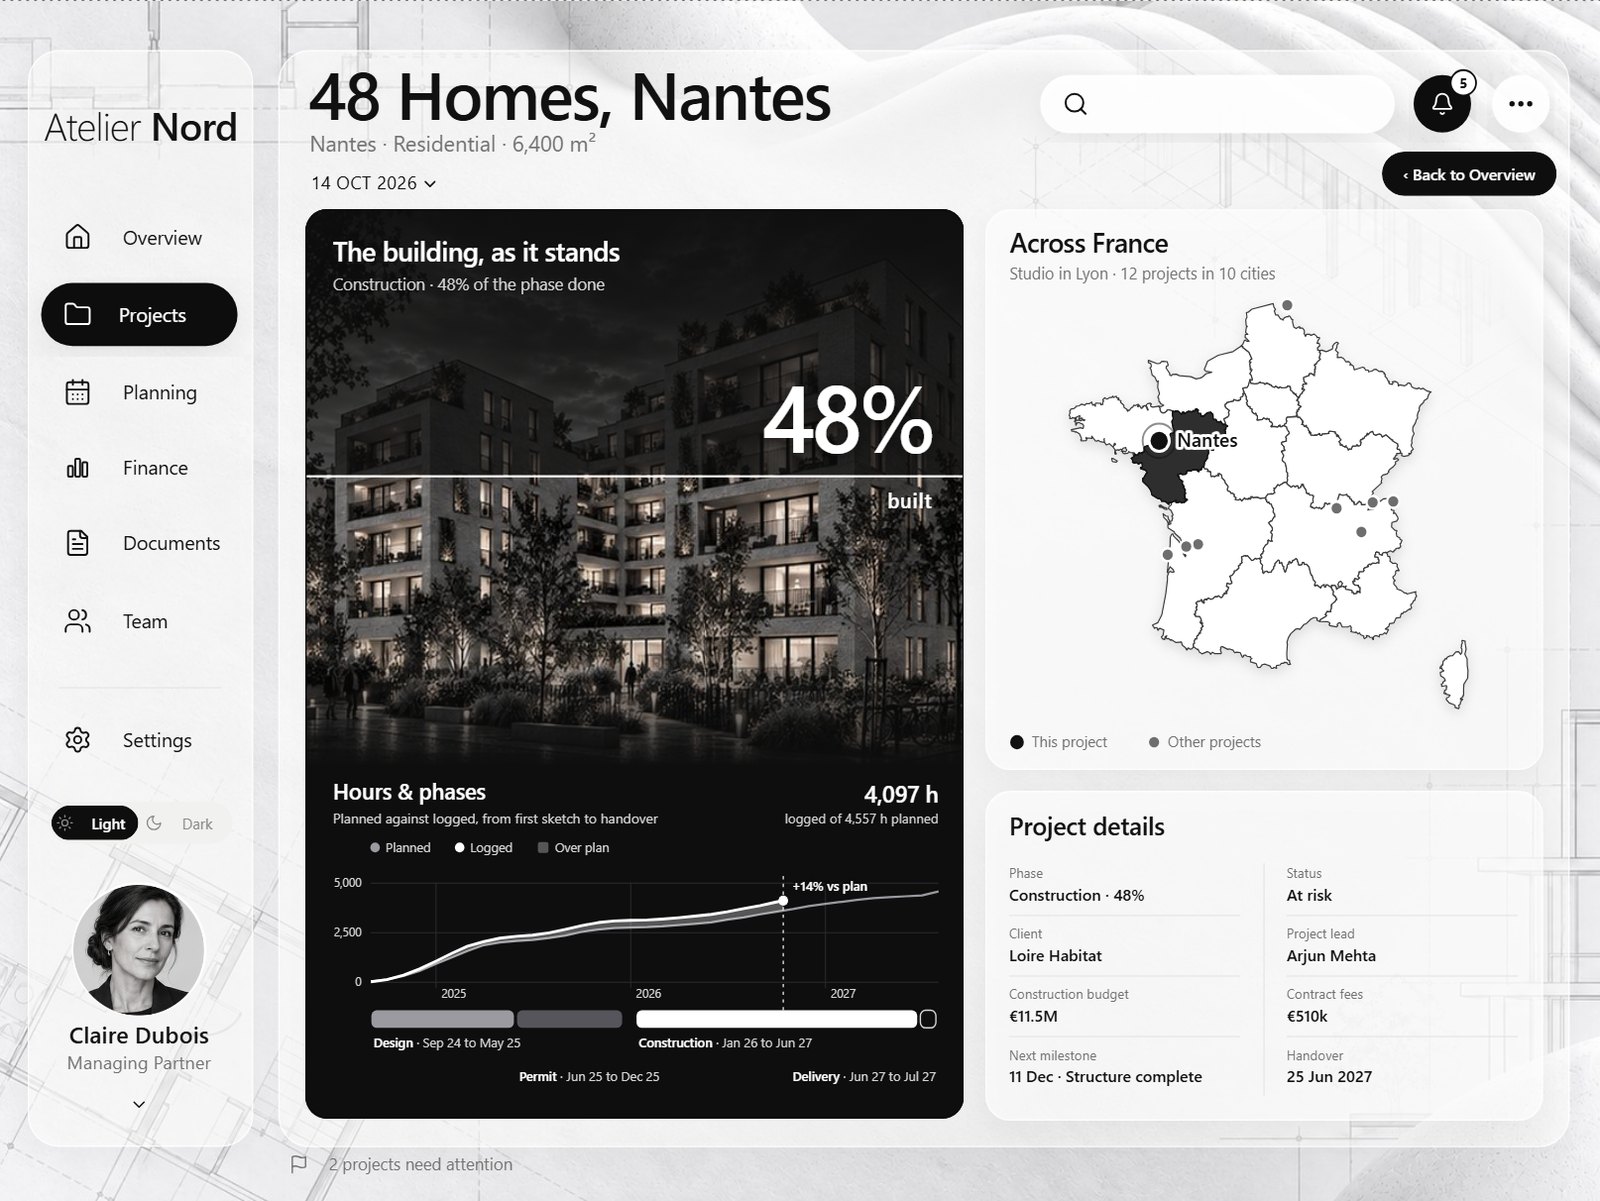
How the building rises: an image that reveals itself up to a percentage.
Notifications and New milestone
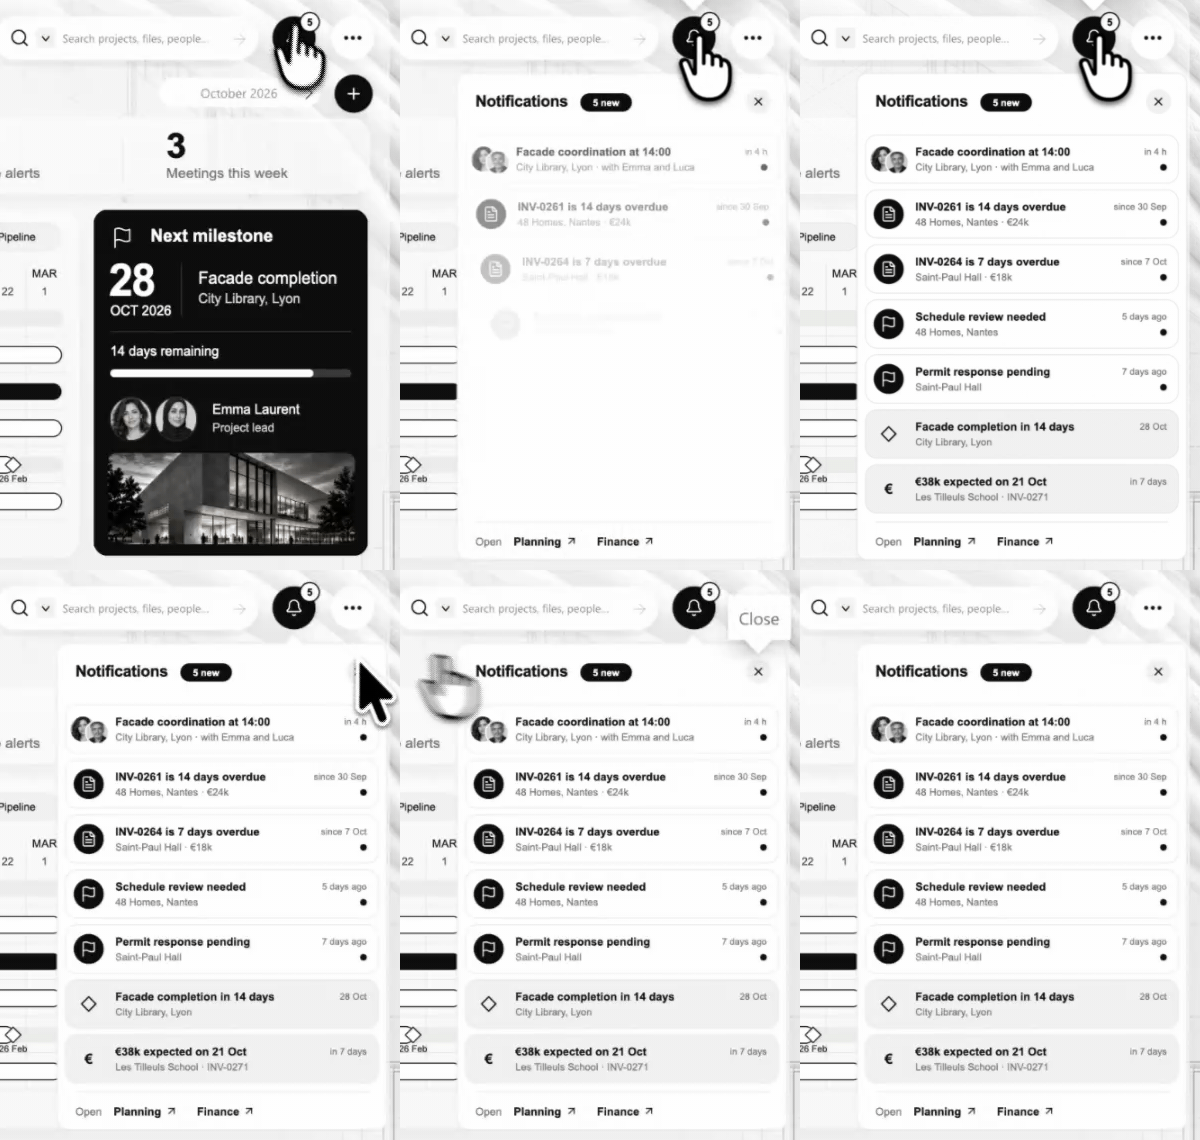
The bell opens the notifications: a meeting in four hours, two overdue invoices, a schedule review, a permit response, a facade to complete in 14 days, a payment expected next week. The + of Next milestones opens a panel to plan a milestone: pick a project, a type, a name and a date, and the preview shows where it lands on the project's timeline.
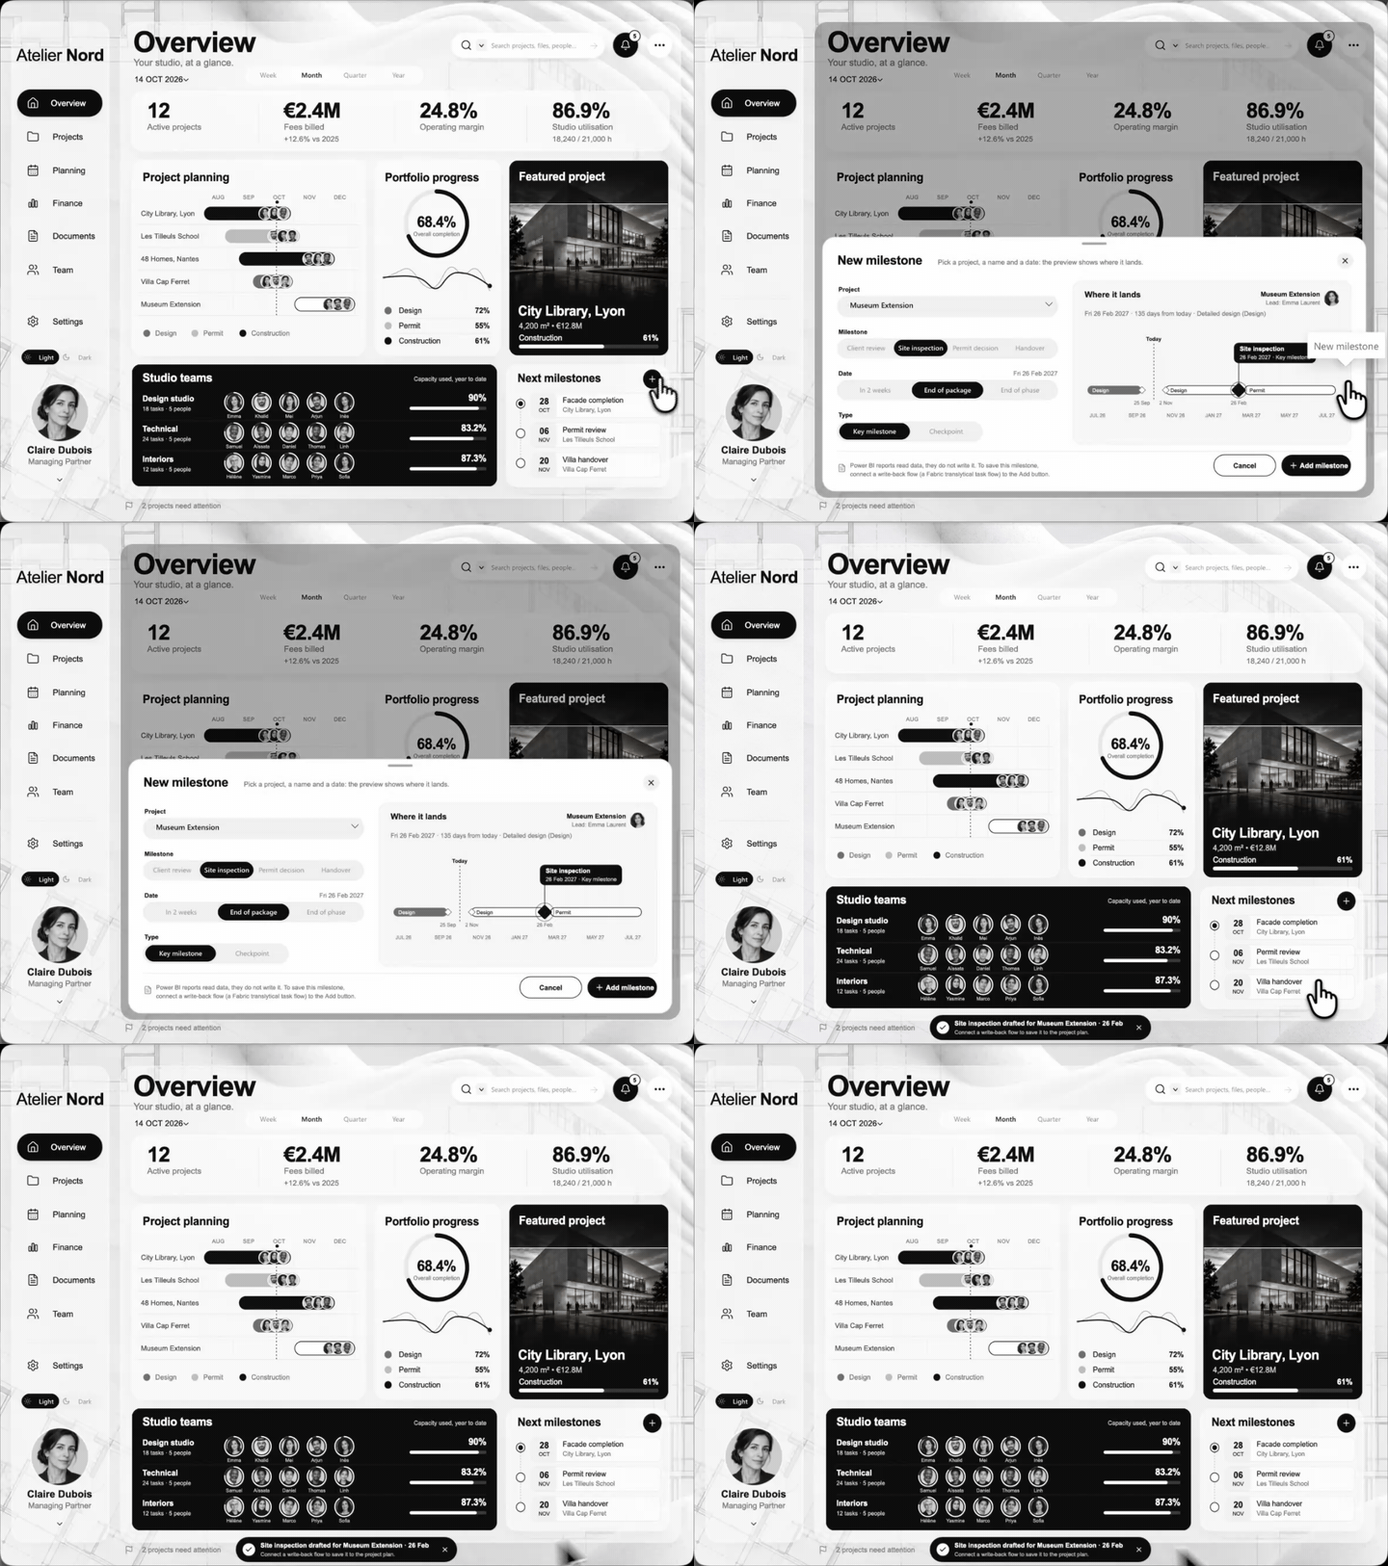
Saving the milestone would need a write-back flow, such as a Fabric translytical task flow. The panel says so in its footer.
Light and Dark
One slicer in the sidebar switches every page. The plaster gives way to the same architectural plans on black paper, the glass panels turn to smoked glass you can see through, the black cards turn white, and the renders and the portraits stay as they are.
Four techniques inside
A Gantt made of table rows
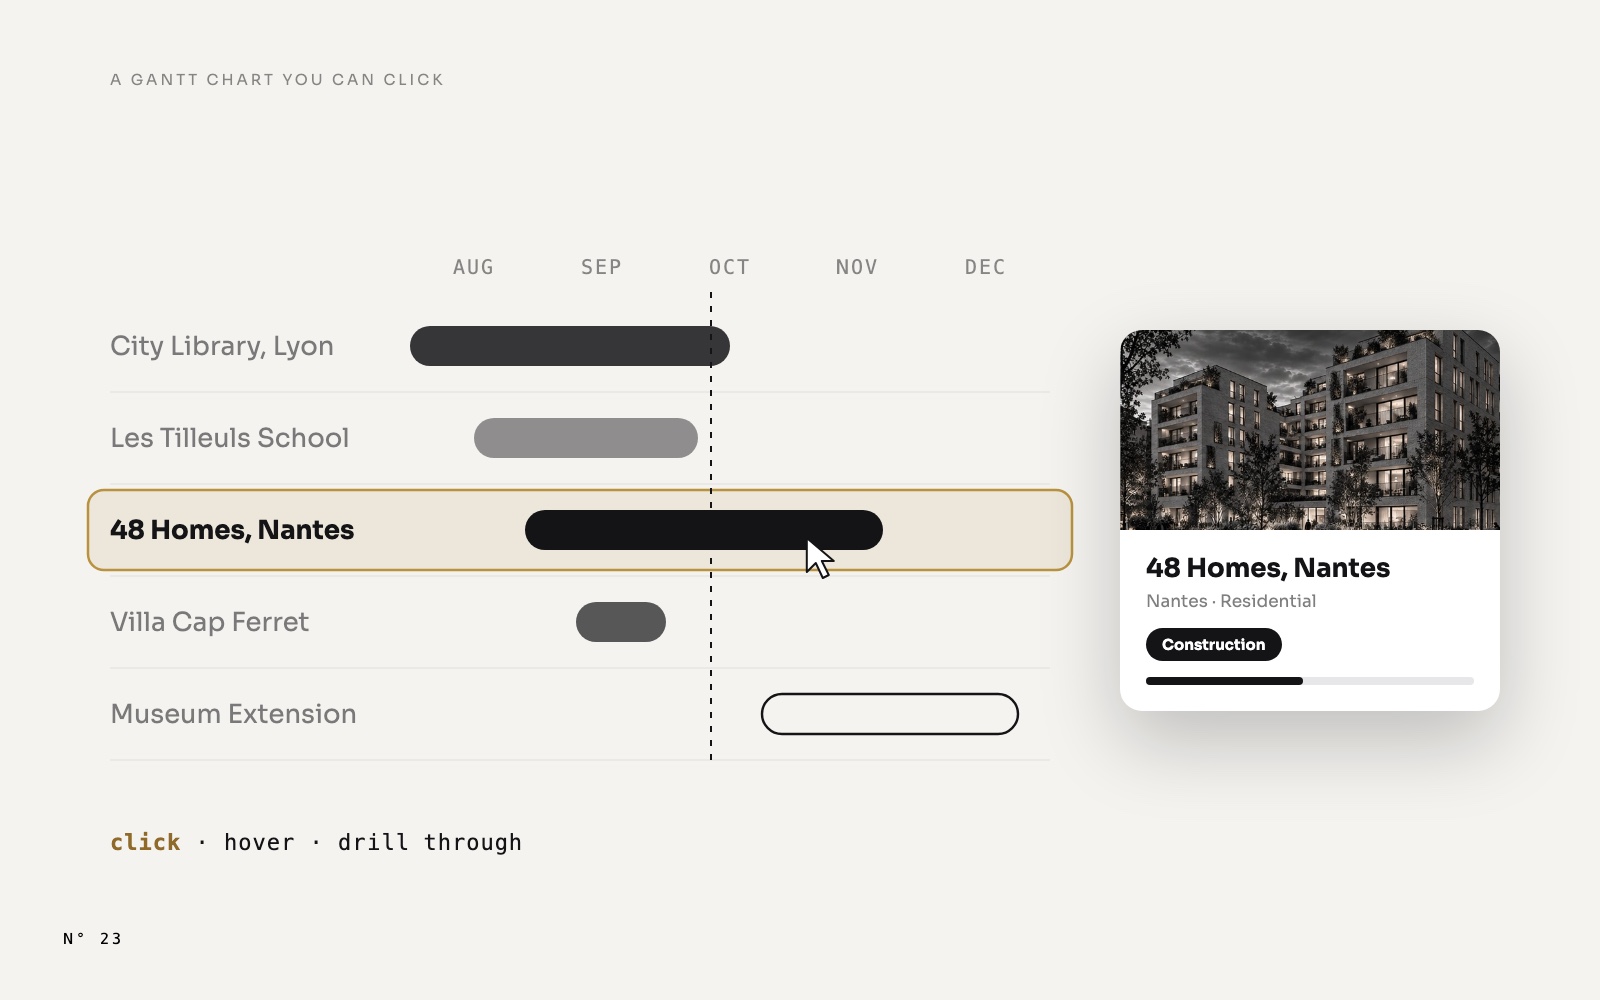
The Gantt is the native table visual. Its only visible column is an SVG measure that draws one project per row, and a 1 px column holds the project. Because each row is a data point, the Gantt gets selection, a report page tooltip and drill-through, like any table. The month axis is a separate card laid over the table header. The whole method: a Power BI Gantt chart you can click, hover and drill into.
Numbers that count up
The KPIs of every page count from zero to their value in about a second. SVG can't animate a number, so each KPI is 25 versions of its text, each one shown for 50 milliseconds, with an ease-out so the count slows down at the end. The last version is the one shown by default, so a static export never catches a zero. The method: KPI numbers that count up.
A building that rises to its progress
The project page shows the building rising to the share of its phase that is done. The render is drawn twice in the same SVG: a pale copy, and a sharp copy clipped by a rectangle that climbs to the progress, with a white line at its front and the percentage counting along with it. The method: an image that reveals itself up to a percentage.
A card on hover, a page on right-click
The hover card and the project page are two hidden pages. One is a tooltip page, the other a drill-through page, both on the project. Every table whose first column is the project uses them: the two Gantts, the register, the profitability table and the invoices.
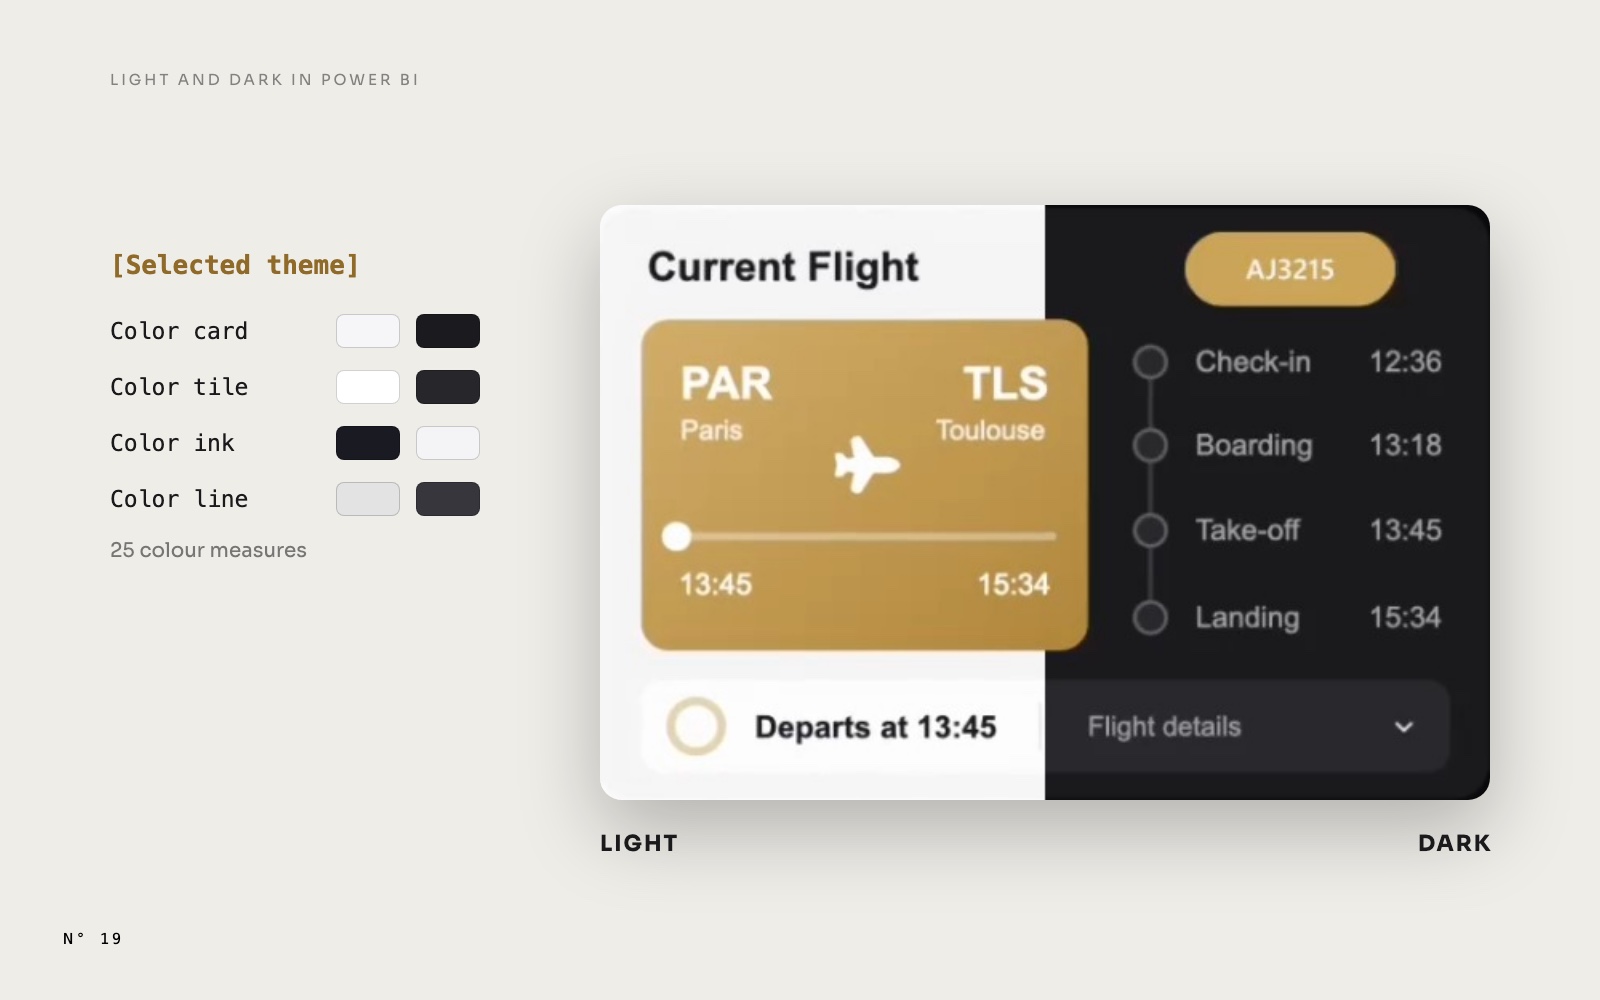
Atelier Nord also reuses the techniques of Aurum Jet: Light and Dark mode with colour measures, images over 32,766 characters split into chunks, and staggered SVG animations for the bars, the rings and the curves.
How it was built
Atelier Nord started from four mockups made with an image model: Overview, Projects, Planning and Finance. From there, an AI agent wrote the report as code: the data generated and calibrated on the mockups, the model in TMDL, the report in PBIR, and every drawing as an SVG measure. After each change, the report was reopened in Power BI Desktop, captured page by page and compared with the mockups. The clicks, the hovers and the drill-throughs were tested there too.
The human part: the design direction, the renders and the portraits, the review, and a long list of "move this a little".
A report like this on your own data
Atelier Nord is a showcase, built on a fictional model. If you want a report like this one for your team, on your own model, ChartCraft Bespoke builds it for you.
What you may do with it
Atelier Nord is released under the MIT License: use it, adapt it and share it, including in commercial and client work, as long as the copyright notice stays with it. A few parts keep their own licences, listed in THIRD-PARTY-NOTICES.md:
- Icons: Lucide, under the ISC License, in
LICENSES/lucide.txt. - Map of France: the regions come from france-geojson, under the Etalab Open Licence 2.0, simplified for the report.
- Renders and portraits: all generated with AI. They show no real building and no real person.
- Data: the studio, its clients and every number are fictional.
Download
- The Atelier Nord page: the report in video and in screenshots, and the download button.
- The GitHub repository: browse the files online. The zip is the asset of the latest release, and this direct link always points to it.
- Our other free reports: Aurum Jet, a private jet operator, and Colis Pro, a parcel network with 4 million shipments.
FAQ
Do I need to install anything besides Power BI Desktop?
No. There is no custom visual in the report. Power BI Desktop for Windows, which is free, opens it as is.
Does it work in the Power BI Service?
Yes. We published the report and checked it in the browser: the clickable planning, the project card on hover, the drill-through, the bookmarks, the animations and the Light and Dark switch all work as in Desktop, with a plain click on the buttons.
Can the New milestone panel save a milestone?
Not in this report. A Power BI report reads data, it doesn't write it. To save the milestone, connect a write-back flow to the Add button, for example a Fabric translytical task flow or a Power Apps visual.
Can I use it with my own data?
Not as is: the 192 measures expect the Atelier Nord tables and columns. Reuse its measures and techniques in your own report, or ask ChartCraft Bespoke to build one on your model.
Is it really free?
Yes. No account and no sign-up: download the zip from GitHub. It is released under the MIT License, so you can use it, adapt it and share it, including in commercial and client work.
Part of a series
Atelier Nord · article 1 of 4
- Atelier Nord: a free Power BI report for an architecture studio
- A Power BI Gantt chart you can click, hover and drill into, with no custom visual
- KPI numbers that count up in Power BI, with one DAX measure
- A building that rises to its progress: an image reveal in Power BI
Related articles
 Design techniques8 November 2026
A Power BI Gantt chart you can click, hover and drill into, with no custom visual
 Free reports19 October 2026
Aurum Jet: a free Power BI report with no custom visuals
 Design techniques24 October 2026