

Design techniques
A building that rises to its progress: an image reveal in Power BI
One render, drawn twice in an SVG measure: a pale copy, and a sharp copy revealed up to the percentage done. A progress bar that looks like the project itself.
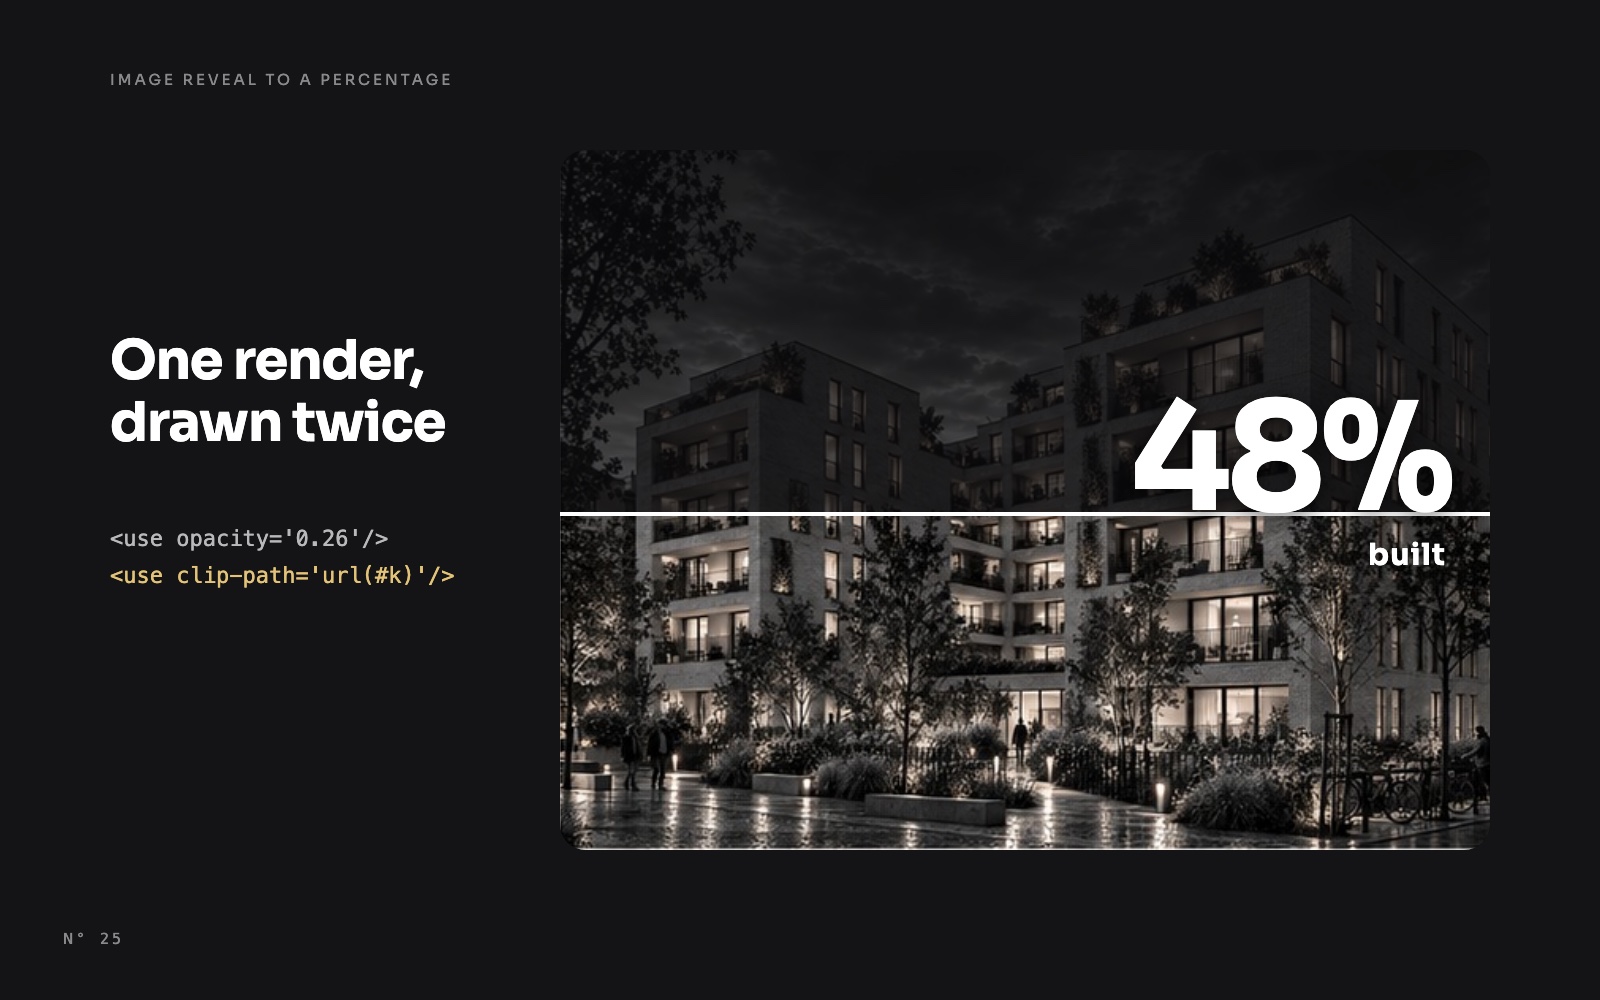
In Atelier Nord, a free Power BI report for an architecture studio, right-click a project and drill through to its page. The first card is the building. It appears as a ghost, and then it builds itself: a sharp image rises from the ground, a white line at its front, and a large percentage climbs with it. It stops at the share of the phase that is done. For 48 Homes in Nantes, 48 %.
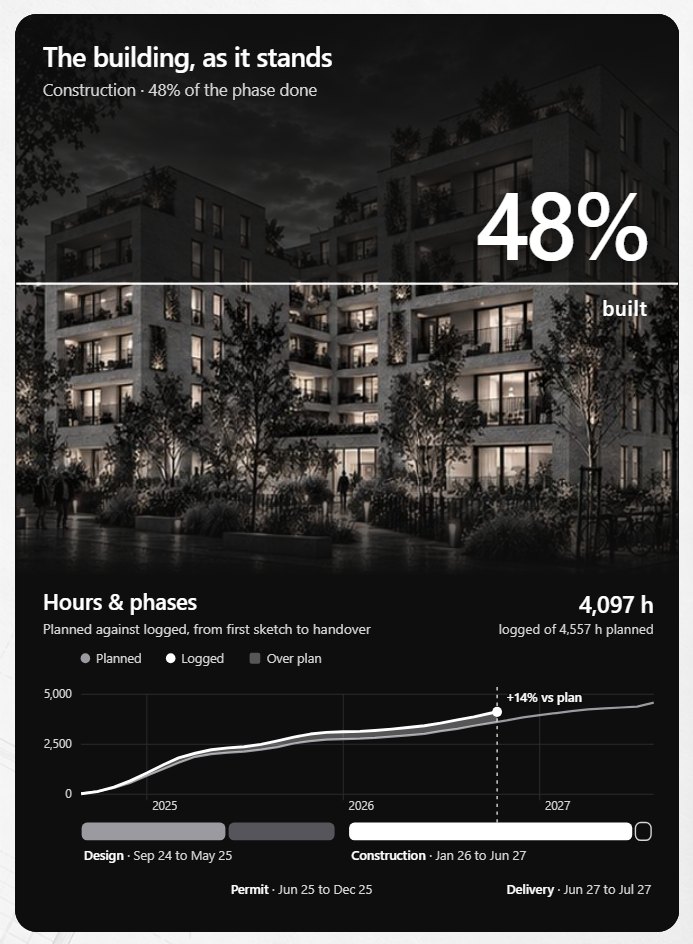
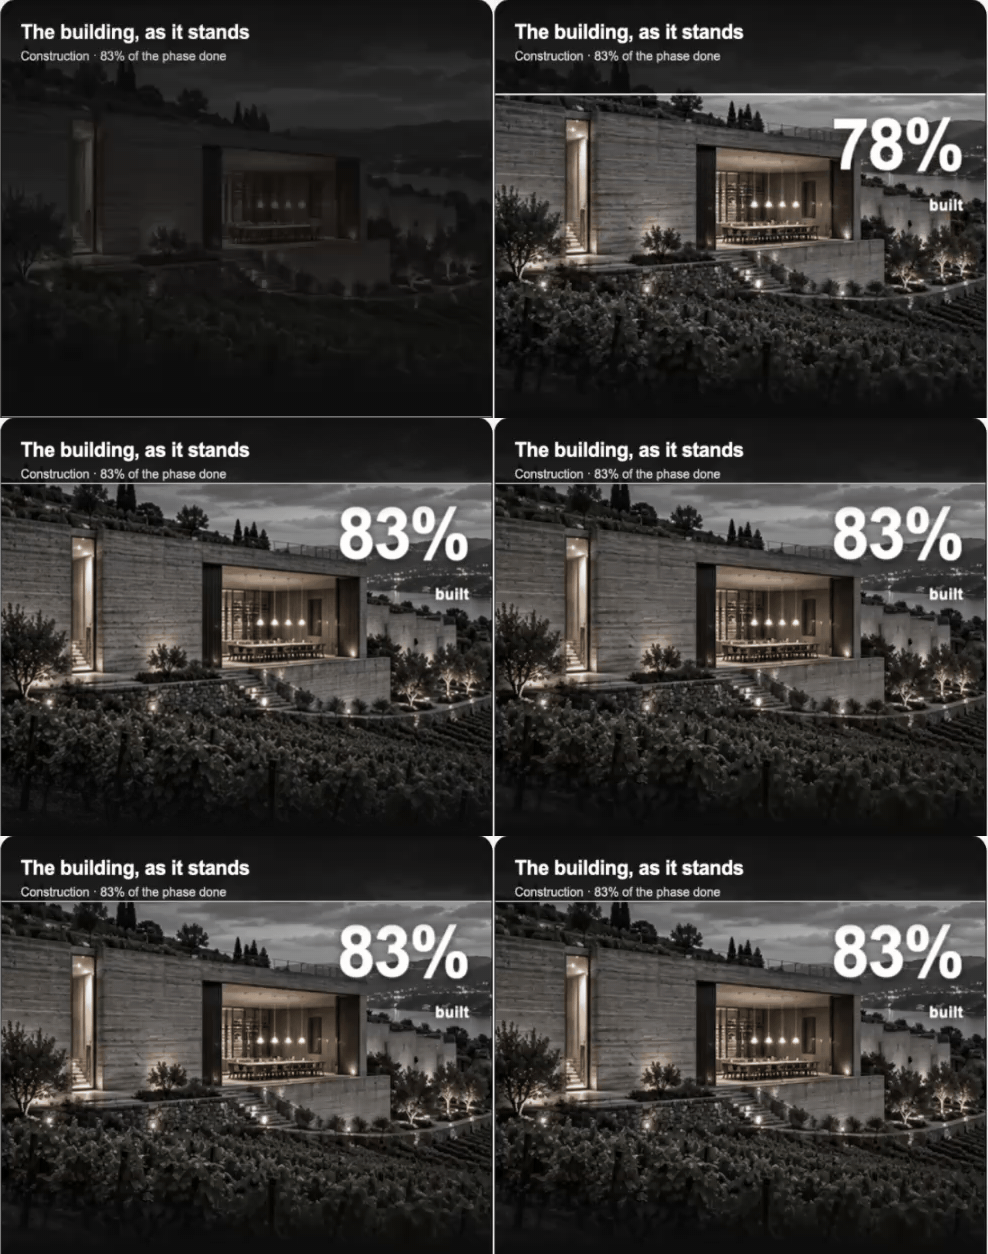
It is a progress bar. It just doesn't look like one: the bar is the building. This article shows how one SVG measure draws it, with one image used twice and a clip that climbs.
The idea: one image, two copies
The card stacks three things, all inside one SVG returned by a DAX measure:
- The ghost. The render at 26 % opacity, over the black card. You see the whole building, faintly, from the first frame.
- The built part. The same render at full opacity, cut by a clip path. The clip is a rectangle anchored at the bottom of the image, and its top climbs to the progress.
- The front. A white line, 2 units high, that climbs with the top of the clip, and the percentage, which counts up along the way.
The reveal reads as "how much is built", without a legend. And because the ghost is there from the start, the eye sees the whole building and how far it still has to go.
The image, written once
The render is a JPEG stored in the model as base64 text, about 90,000 characters. A single text value in a Power BI column stops at 32,766 characters, so the render sits in a calculated table, split into chunks of 30,000, and a measure joins them back in order:
Shown render =
VAR _k = [Shown project key]
VAR _b = CONCATENATEX (
    FILTER ( 'Render image', 'Render image'[ProjectKey] = _k ),
    'Render image'[Chunk], "", 'Render image'[Part], ASC )
RETURN IF ( NOT ISBLANK ( _b ), "data:image/jpeg;base64," & _b )
The same method shows the jets of Aurum Jet.
The card needs that image twice, and writing it twice would double the measure. SVG has a better way: declare the image once in <defs>, give it an id, and draw it with <use> as many times as you want.
<defs>
  <image id='b' x='0' y='0' width='623' height='505'
         preserveAspectRatio='xMidYMid slice' href='data:image/jpeg;base64,…'/>
</defs>
<use href='#b' opacity='0.26'/>
<use href='#b' clip-path='url(#k)'/>
preserveAspectRatio='xMidYMid slice' fills the 623 × 505 area and crops what overflows, like a CSS object-fit: cover. Every render keeps its proportions whatever its size.
The clip that climbs
The clip is a rectangle. It starts at the bottom of the image with a height of 0, and two animations run together: its top moves up, its height grows by the same amount. Its bottom never moves.
"<clipPath id='k'><rect x='0' y='505' width='623' height='0'>"
    & "<animate attributeName='y' from='505' to='" & FORMAT ( 465 * ( 1 - _p ), "0.0", "en-US" )
    & "' begin='0.3s' dur='2.0s' fill='freeze' calcMode='spline' keyTimes='0;1' keySplines='0.33 1 0.68 1'/>"
    & "<animate attributeName='height' from='0' to='" & FORMAT ( 505 - 465 * ( 1 - _p ), "0.0", "en-US" )
    & "' begin='0.3s' dur='2.0s' fill='freeze' calcMode='spline' keyTimes='0;1' keySplines='0.33 1 0.68 1'/>"
    & "</rect></clipPath>"
_p is the progress, between 0 and 1. A few choices hide in these lines:
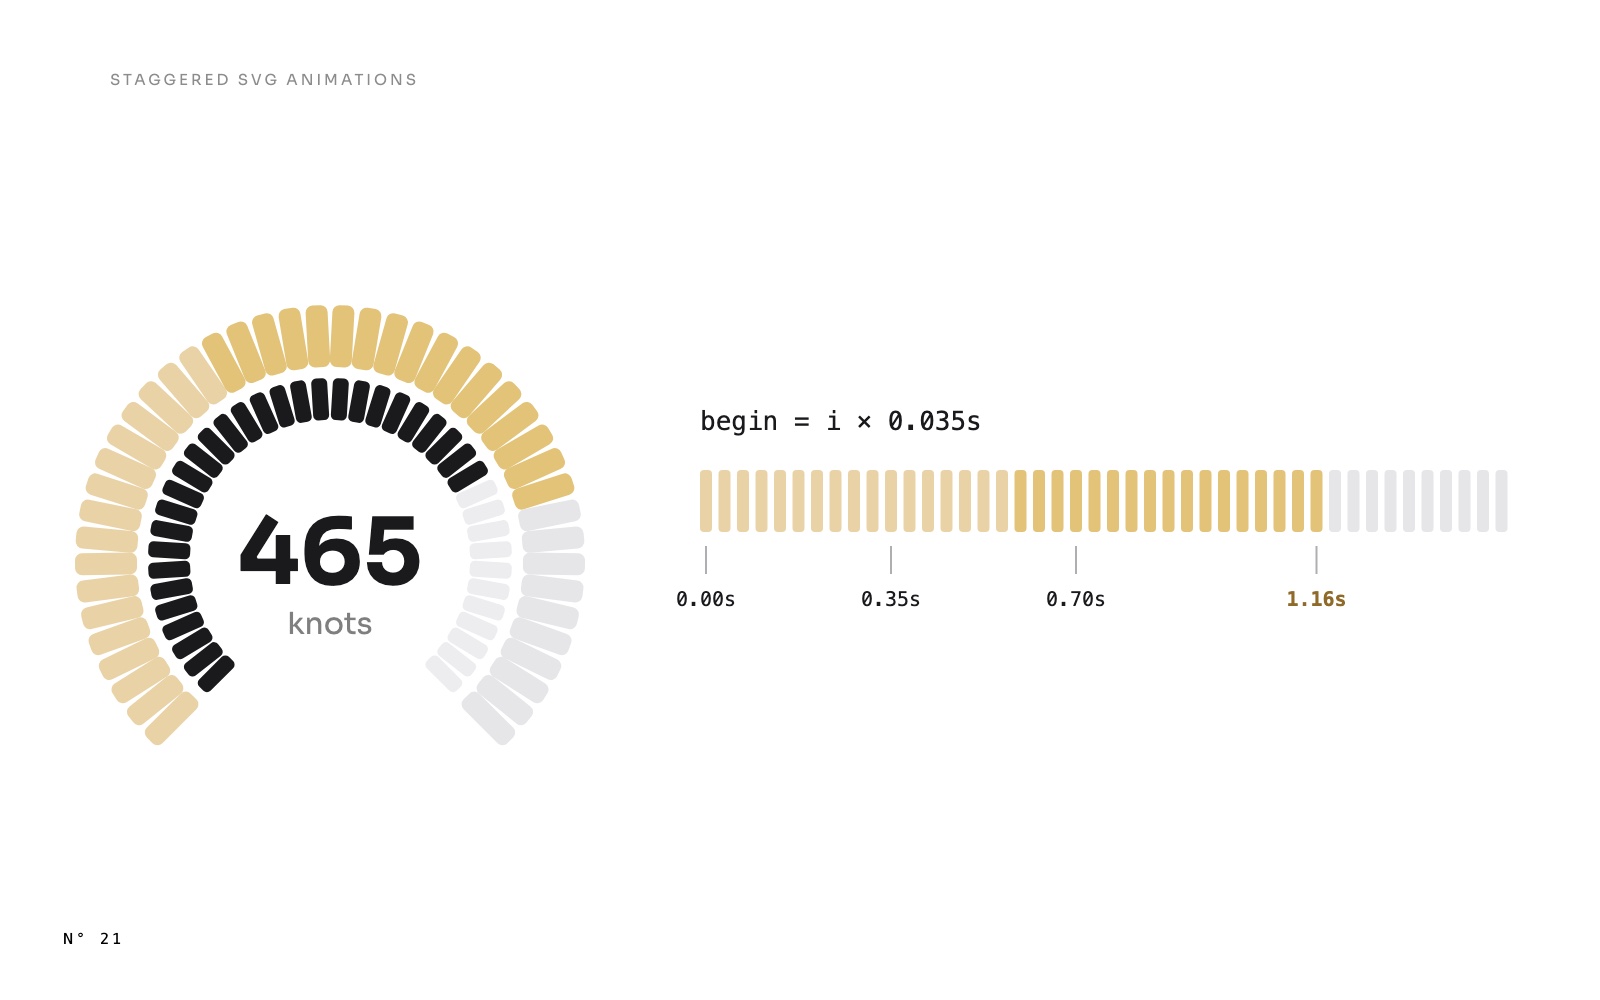
yandheighttogether. An SVG rectangle is placed by its top. Animate the height alone and it grows downwards. The same fix makes bars grow upwards in staggered SVG animations.- 465, not 505. The bottom 40 units of the render sit under a dark gradient, where the card's text starts. A building at 0 % starts at the top of that gradient, not at the edge of the image, so the progress is measured on the 465 units you actually see.
- An ease-out.
keySplines='0.33 1 0.68 1'starts fast and settles slowly. Over 2 seconds, the building shoots up, then finds its level. fill='freeze'. The clip stays where the animation ends. Without it, the building would fall back to the ground.
The front and the label ride along
The white line is a 2-unit rectangle with the same y animation as the clip. It marks the edge between built and not built, and makes the movement visible even on a dark render.
The percentage is bigger: 86 units, in white, with a soft shadow so it reads on any render. It sits in a group that moves with the front, through an animateTransform with the same timing:
"<g transform='translate(0 505)'>"
    & "<animateTransform attributeName='transform' type='translate' from='0 505' to='0 "
    & FORMAT ( 465 * ( 1 - _p ), "0.0", "en-US" )
    & "' begin='0.3s' dur='2.0s' fill='freeze' calcMode='spline' keyTimes='0;1' keySplines='0.33 1 0.68 1'/>"
    & …the label…
    & "</g>"
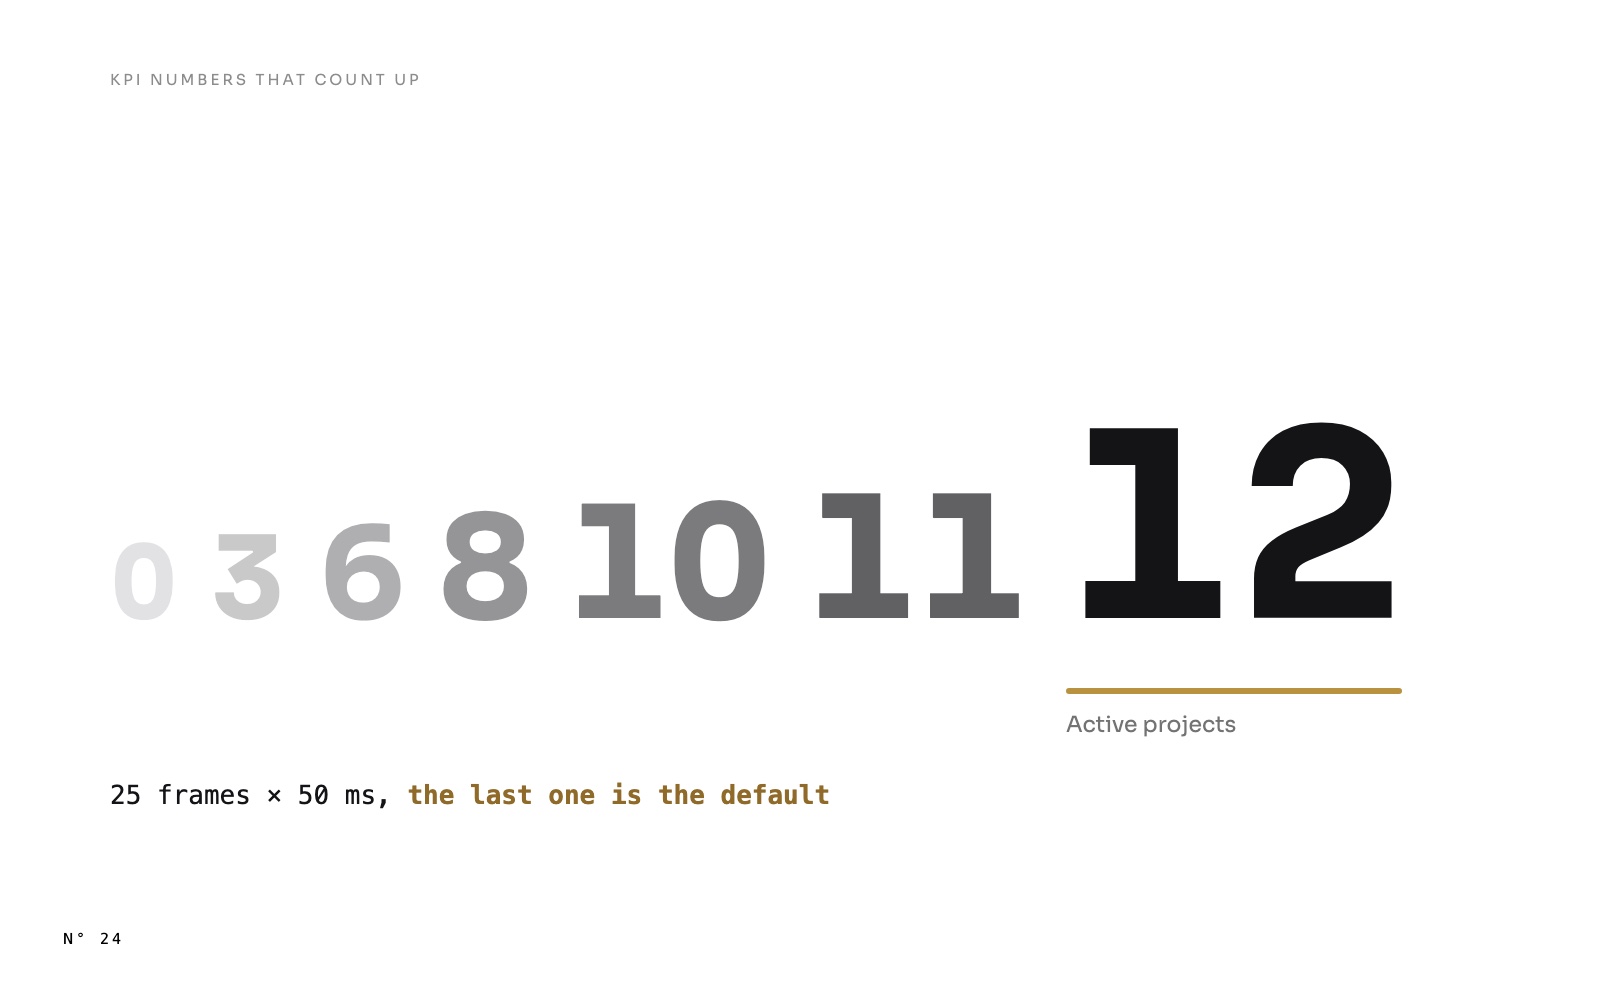
While it climbs, the label counts from 0 % to the progress. That is the count-up of the KPIs, with 31 frames over the same 2 seconds: KPI numbers that count up. The number and the line arrive together.
One last case: a building at 90 % puts its front near the top of the card, and the label would cover the title. When the front is less than 158 units from the top, the label moves under the line instead of above it:
"<g transform='translate(0 " & IF ( 465 * ( 1 - _p ) < 158, 112, 0 ) & ")'>"Where the progress comes from
The card shows the progress of the project's current phase, DimProject[PhaseProgress]: 48 % of the construction of 48 Homes, 61 % of the construction of City Library, 72 % of the design of Villa Cap Ferret. The subtitle says it in words: "Construction · 48 % of the phase done".
The page is a drill-through page, so the project comes from the row you right-clicked, and the card reads it through [Shown project key]. The animation replays each time you arrive on the page: drill into another project, and its building rises from the ground.
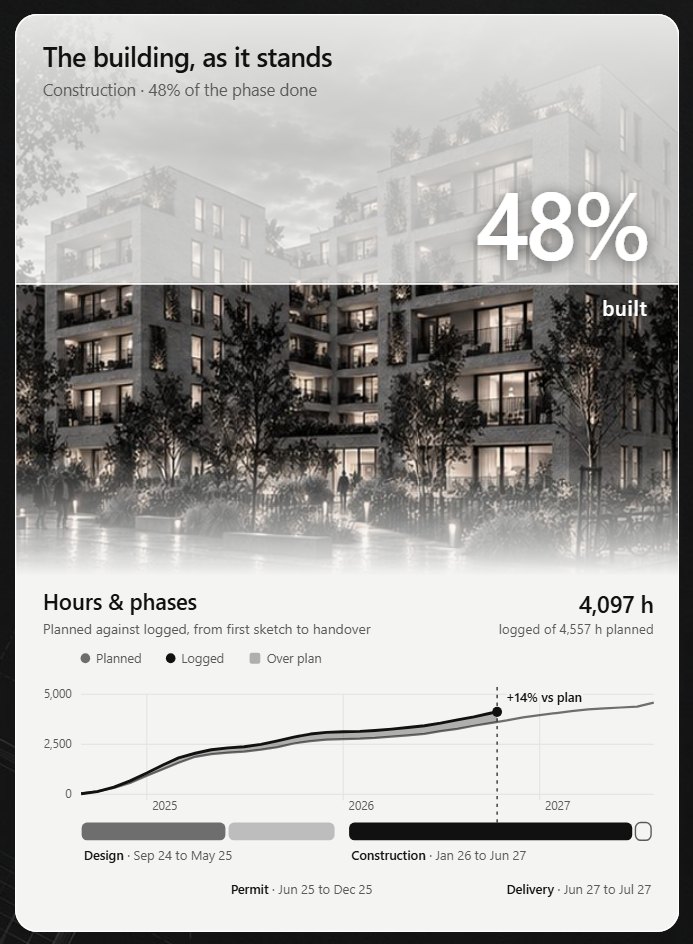
The Featured project card of the Overview uses the same function, smaller, without the label. Click a project in the planning, and its building rises in the card.
Build it in Power BI Desktop
- Store the image in the model: a calculated table with the image key, the chunk order and a 30,000-character chunk, and a measure that joins the chunks into a data URI.
- Write the SVG measure: the image in
<defs>, a first<use>at low opacity, a second<use>clipped by aclipPath. - Animate the clip's rectangle:
yfrom the bottom tobottom × ( 1 - progress ),heightfrom 0 to the rest, same begin and duration,fill='freeze'. - Add the front: a thin rectangle with the same
yanimation. - Add the label, in a group moved by an
animateTransformwith the same timing. - Finish the measure: replace
%by%25and#by%23, set the category to Image URL, show it in a card.
The traps
- The image must be written once. Two
<image>elements with the same base64 double the length of the measure.<defs>and<use>keep one copy. - 32,766 characters per value. A column can't hold a full render in one text value: split it. The measure that joins the chunks can return a much longer text.
yalone grows downwards. Animateyandheighttogether, or the building is revealed from the top.- End on the visible state. If an export or a thumbnail draws the SVG without playing it, it shows the attributes as written. Here, the clip starts at 0, so a static capture would show the ghost only. If that matters for your report, write the clip at its final size and animate
fromthe bottom. - A screenshot catches one instant. An export or an automated capture can catch the building mid-rise, with a label under the final value. Record the screen to judge the animation.
- Escape the text. The subtitle uses the phase name, and any
&coming from the data must become&.
Try it
- Atelier Nord: download the report, drill through to any project and watch its building rise. The measure is
Project block (SVG); the Featured card usesFeatured (SVG). - The count that climbs with it: KPI numbers that count up.
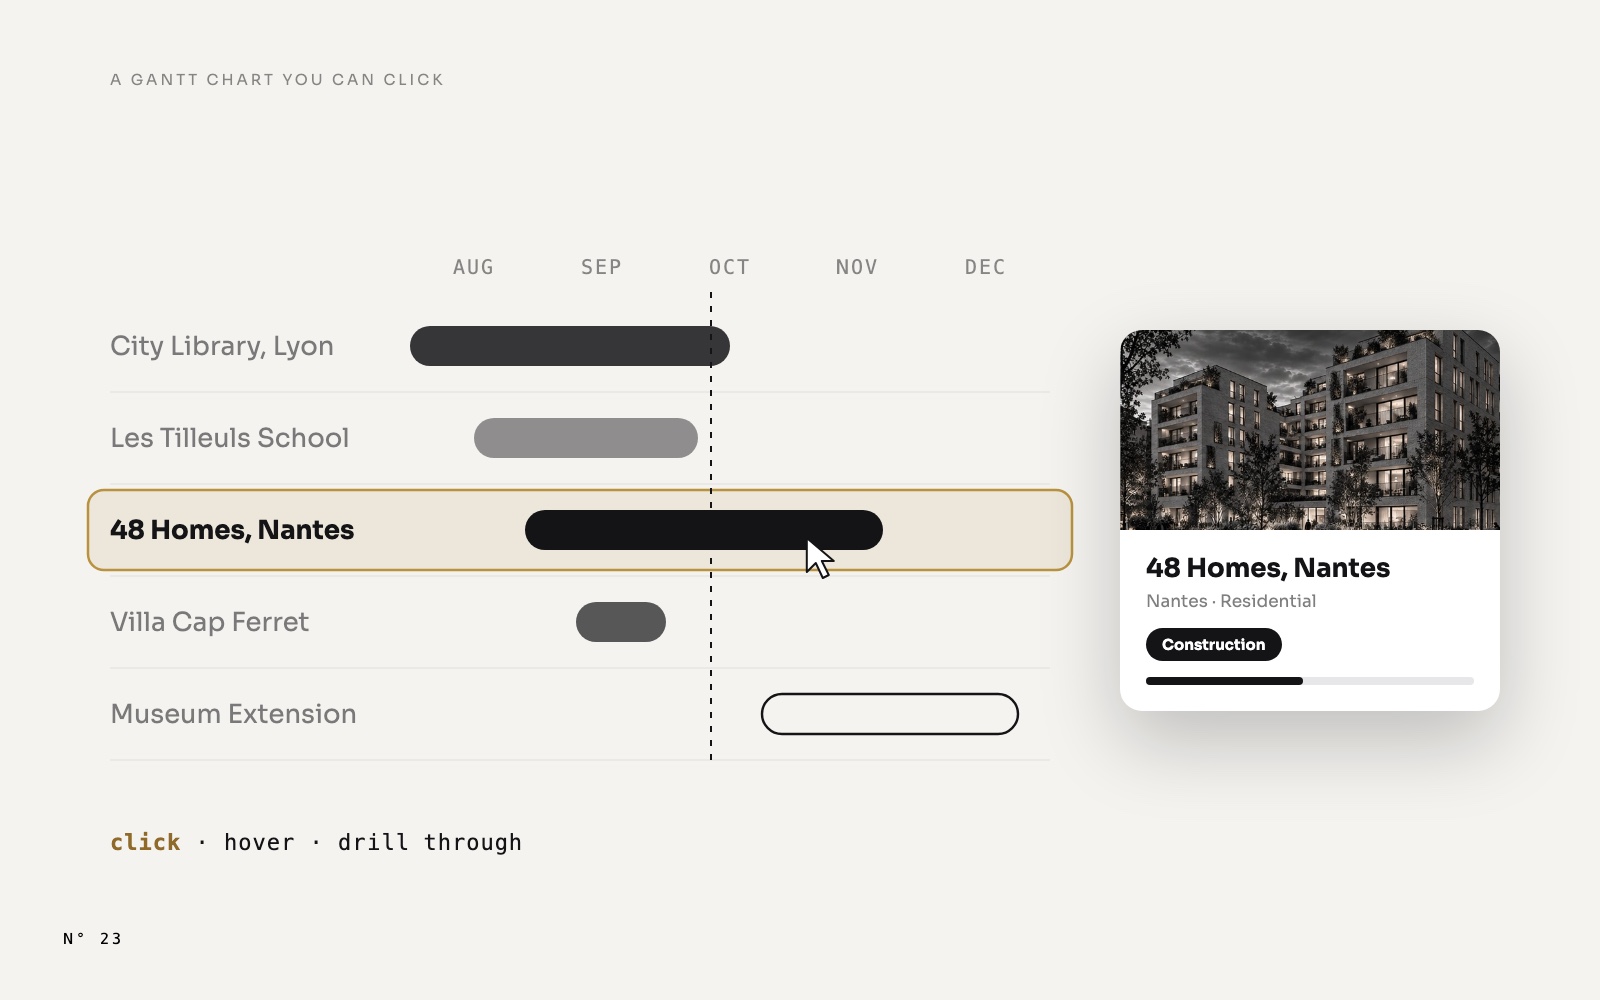
- How the page opens from a Gantt row: a Power BI Gantt chart you can click, hover and drill into.
FAQ
Does it need a custom visual?
No. The building is a native card showing an SVG measure. The image is base64 text in the model.
Does it work with any image?
Yes. A render, a product photo, a map, a drawing. It works best when the image has a clear bottom and top, so that rising from the ground means something: a building, a bottle that fills, a stack of boxes.
Can it reveal from left to right instead?
Yes. Animate width instead of y and height, and the image is revealed like a classic progress bar.
Is a large image slow?
A 640-pixel JPEG is about 90,000 characters of text. Atelier Nord holds 12 renders, 12 thumbnails and 24 portraits in its model, and pages open without visible delay in Desktop. Keep the images as small as the card needs.
Part of a series
Atelier Nord · article 4 of 4
- Atelier Nord: a free Power BI report for an architecture studio
- A Power BI Gantt chart you can click, hover and drill into, with no custom visual
- KPI numbers that count up in Power BI, with one DAX measure
- A building that rises to its progress: an image reveal in Power BI
Related articles
 Design techniques8 November 2026
KPI numbers that count up in Power BI, with one DAX measure
 Design techniques8 November 2026
A Power BI Gantt chart you can click, hover and drill into, with no custom visual
 Design techniques24 October 2026