

Free Power BI project
Colis Pro, a Power BI report built by an AI agent.
A fictional parcel carrier and its complete report: five pages, an alerts panel and a settings panel, French and English. Built with Claude Code through the Power BI Desktop Bridge. Free to download and take apart.
103 MB zip · PBIP, PBIR, TMDL, Parquet · Power BI Desktop for Windows
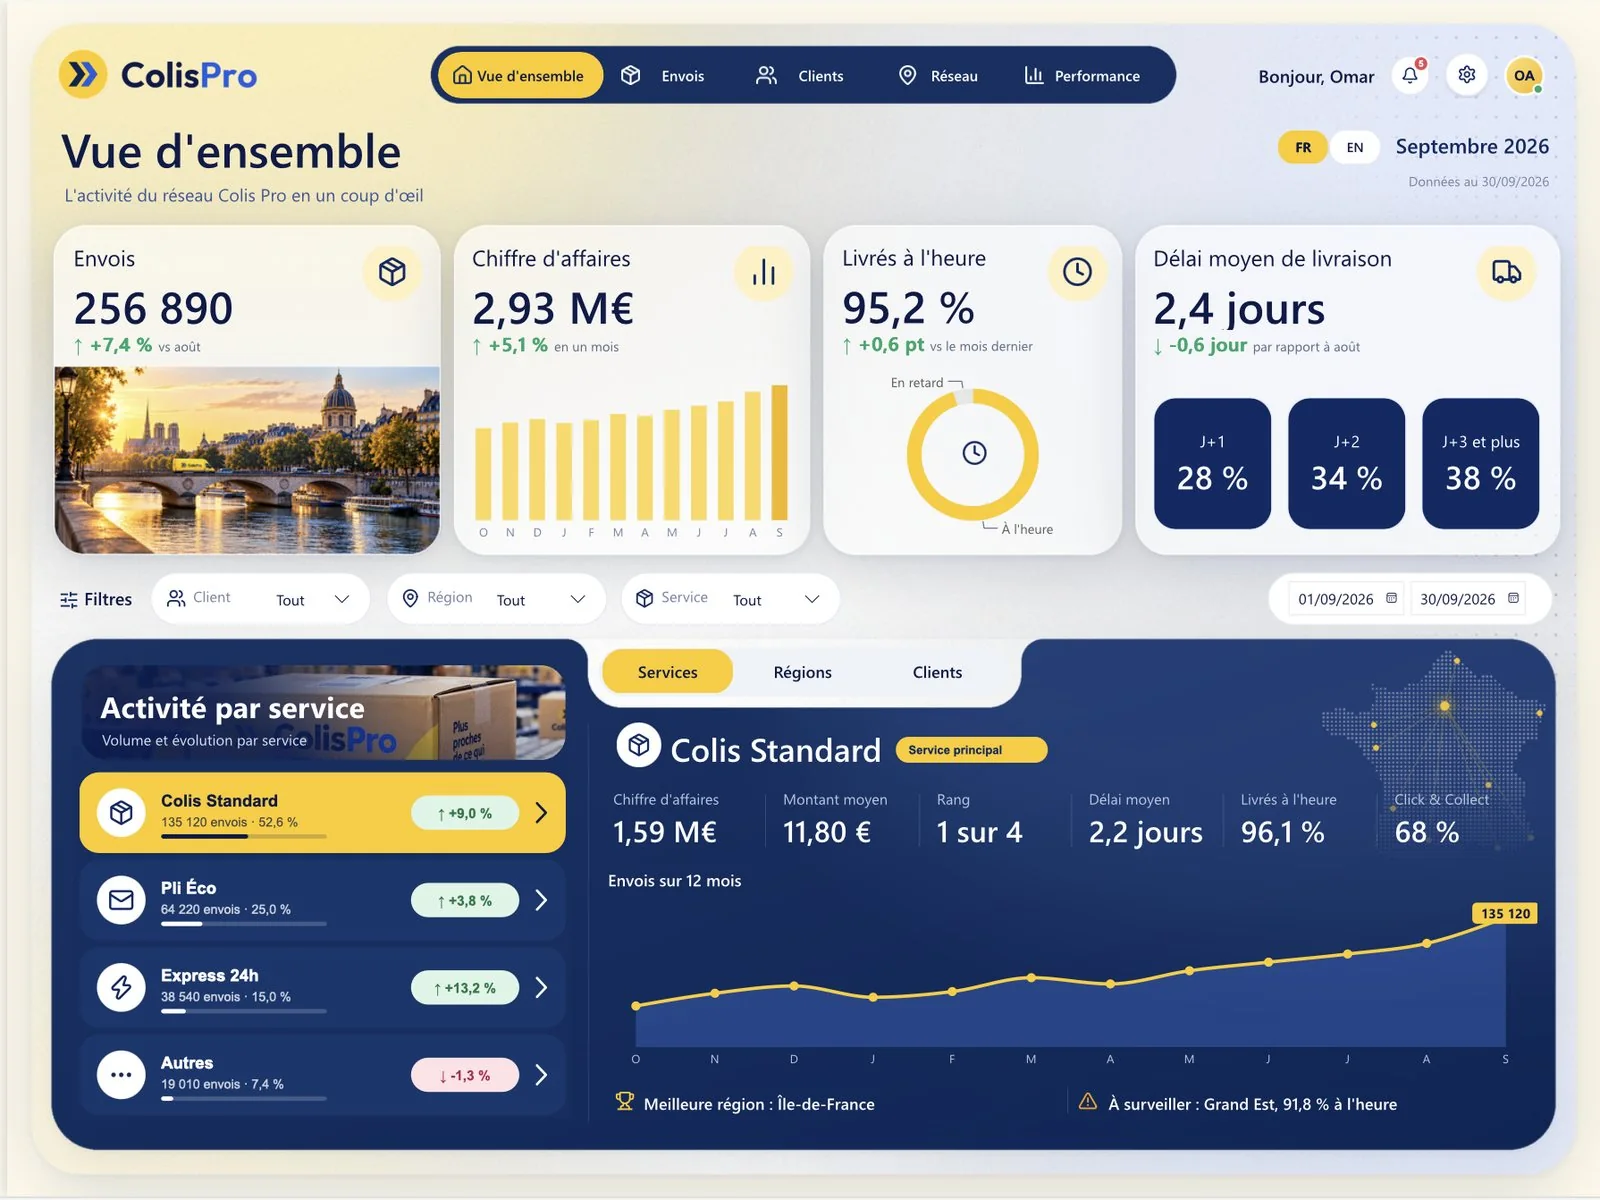
- pages and panels
- 5 + 2pages and panels
- visuals
- 347visuals
- DAX measures
- 465DAX measures
- tables
- 30tables
- shipments
- 4Mshipments
The report
Five pages, two panels.
Every page shares one frame, one menu and one filter bar. The two panels open over the report like an app: live alerts, and the settings that drive every target.
Late shipments, volumes, delivery time and Click & Collect, then the recent shipments with a tracking timeline for the selected parcel.
Bilingual
French or English,
in one click.
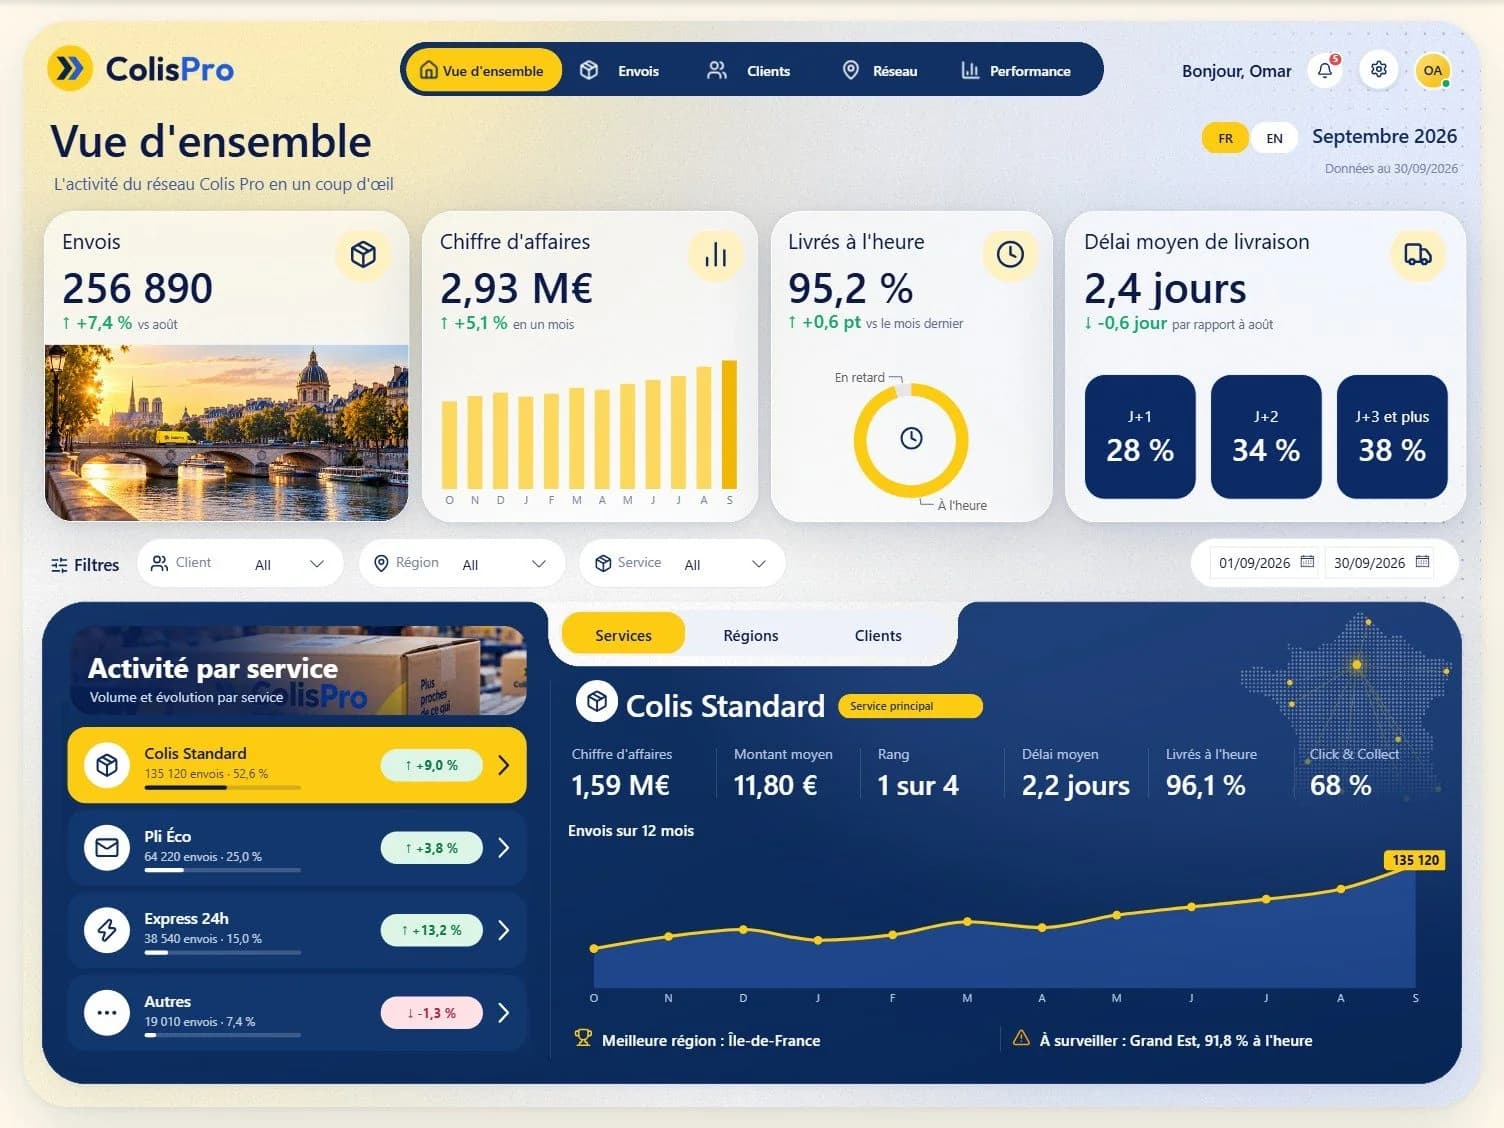
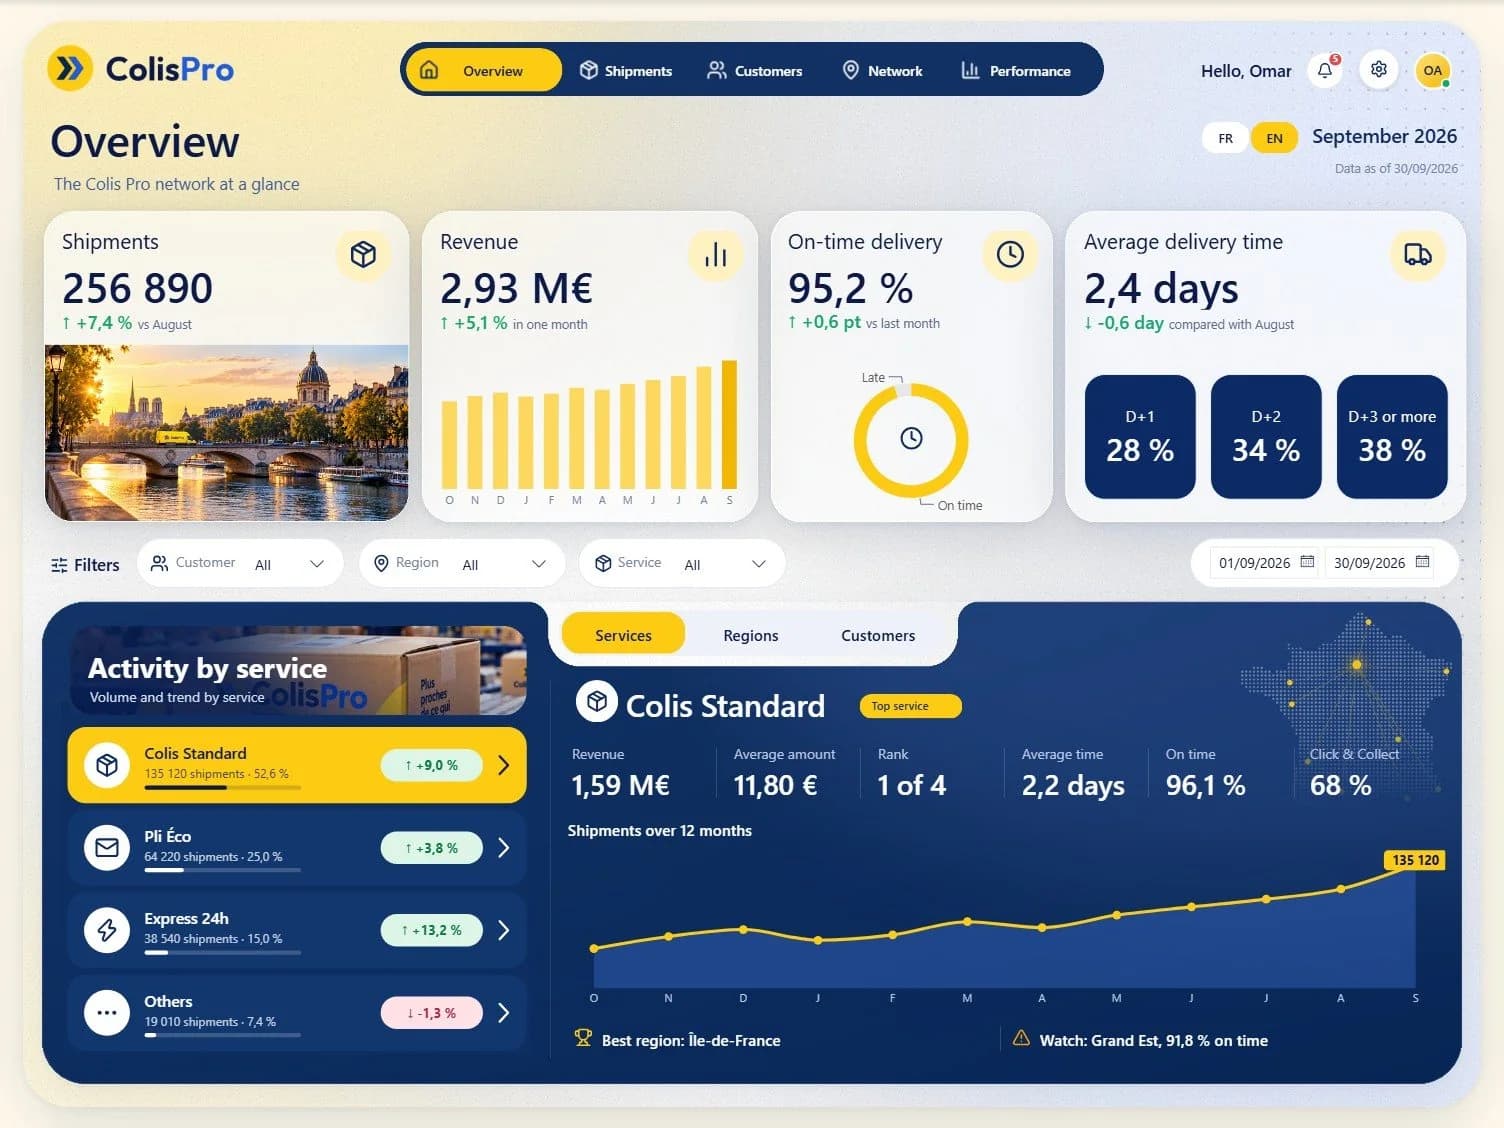
Menu, titles, KPI cards, filters, tabs, even the donut legend. One language slicer drives every label through DAX measures, so the whole page switches at once.
What's inside
A real project, not a screenshot.
The files the agent wrote and Desktop opened, minus the caches. Open them in VS Code, read the measures, reuse the pages.
ColisPro.zip · 103 MB
ColisPro/
├── ColisPro.pbip            the file to open
├── ColisPro.Report/         PBIR, one JSON per visual
├── ColisPro.SemanticModel/  TMDL, 30 tables
├── data/                    Parquet + the generator
├── assets/backgrounds/      layered SVG, for Figma
└── README.md                how to open it, EN and FR
- PBIP
- PBIR
- TMDL
- Parquet
- SVG
347 visuals. Only 9 are charts.
The design lives in cards, buttons and slicers, the way a designer would build it.
- Cards167
- Slicers and tabs52
- Buttons51
- Images and shapes44
- Text boxes17
- Charts9
- Tables and matrix7
How it was built
77 rounds,
one agent, one Desktop.
Claude Code wrote every file. The Power BI Desktop Bridge let it open the report in Desktop and look at its own render, instead of guessing. Every round was reviewed before the next one.
- 01
Mockups
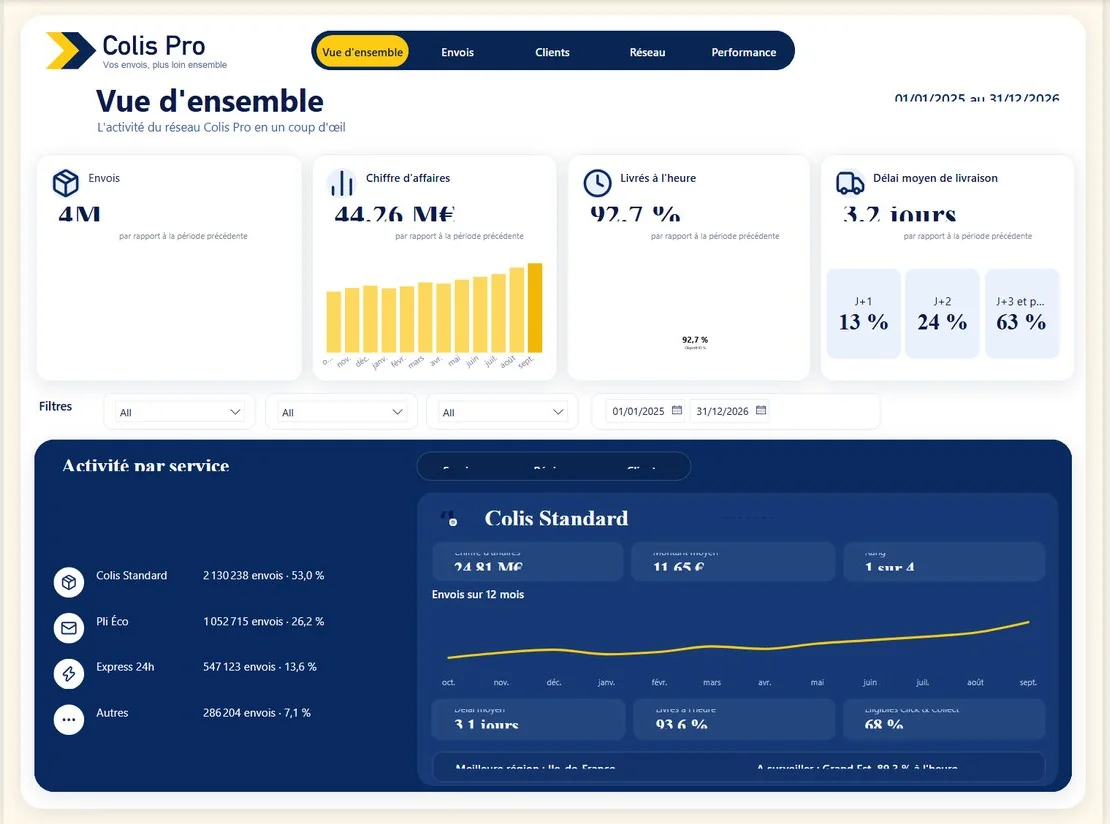
Five page mockups, generated as images. They are the brief, not the result.
- 02
Data and model
Python generates 4 million shipments, calibrated on the mockups. The agent writes the model in TMDL: 30 tables, 465 measures.
- 03
Report
Scripts write the report in PBIR, one JSON file per visual: backgrounds, cards, charts, slicers, panels.
- 04
The Desktop loop
Through the Power BI Desktop Bridge, the agent reloads the report in Desktop, captures every page and reads its own render.
- 05
Review
Each round is reviewed and the next fixes decided. The agent applies them, reloads and captures again. 77 rounds in two days.
Open it
Three steps, then refresh.
- 01
Unzip
Extract the folder to
C:\ColisPro. - 02
Open
Open
ColisPro.pbipin Power BI Desktop. - 03
Refresh
Click Refresh. The data loads from the Parquet files.
Unzipped somewhere else? In Desktop, open Transform data, then Edit parameters, and point DossierDonnees to the data folder.
ChartCraft
Start from a designed base,
on your own model.
Colis Pro took 77 rounds by hand. ChartCraft Forge generates a designed Power BI project in one click, and its MCP server lets your agent forge one bound to your own semantic model. You take it from there.
Questions
Before you open it, the answers.
Icons by Lucide (ISC License). Base map drawn from france-geojson (Etalab Open Licence 2.0). Photos and mockups generated with AI.