

Series
Three hand-built Power BI reports, one idea each
Three reports built by hand for industry, people analytics and healthcare, each shared for free with its project. One article per report explains the idea that makes it work: a floor plan as a map, a sidebar made of bookmarks, a month picker for every KPI.
See the reports3 articles
 Free reports22 October 20264 min read
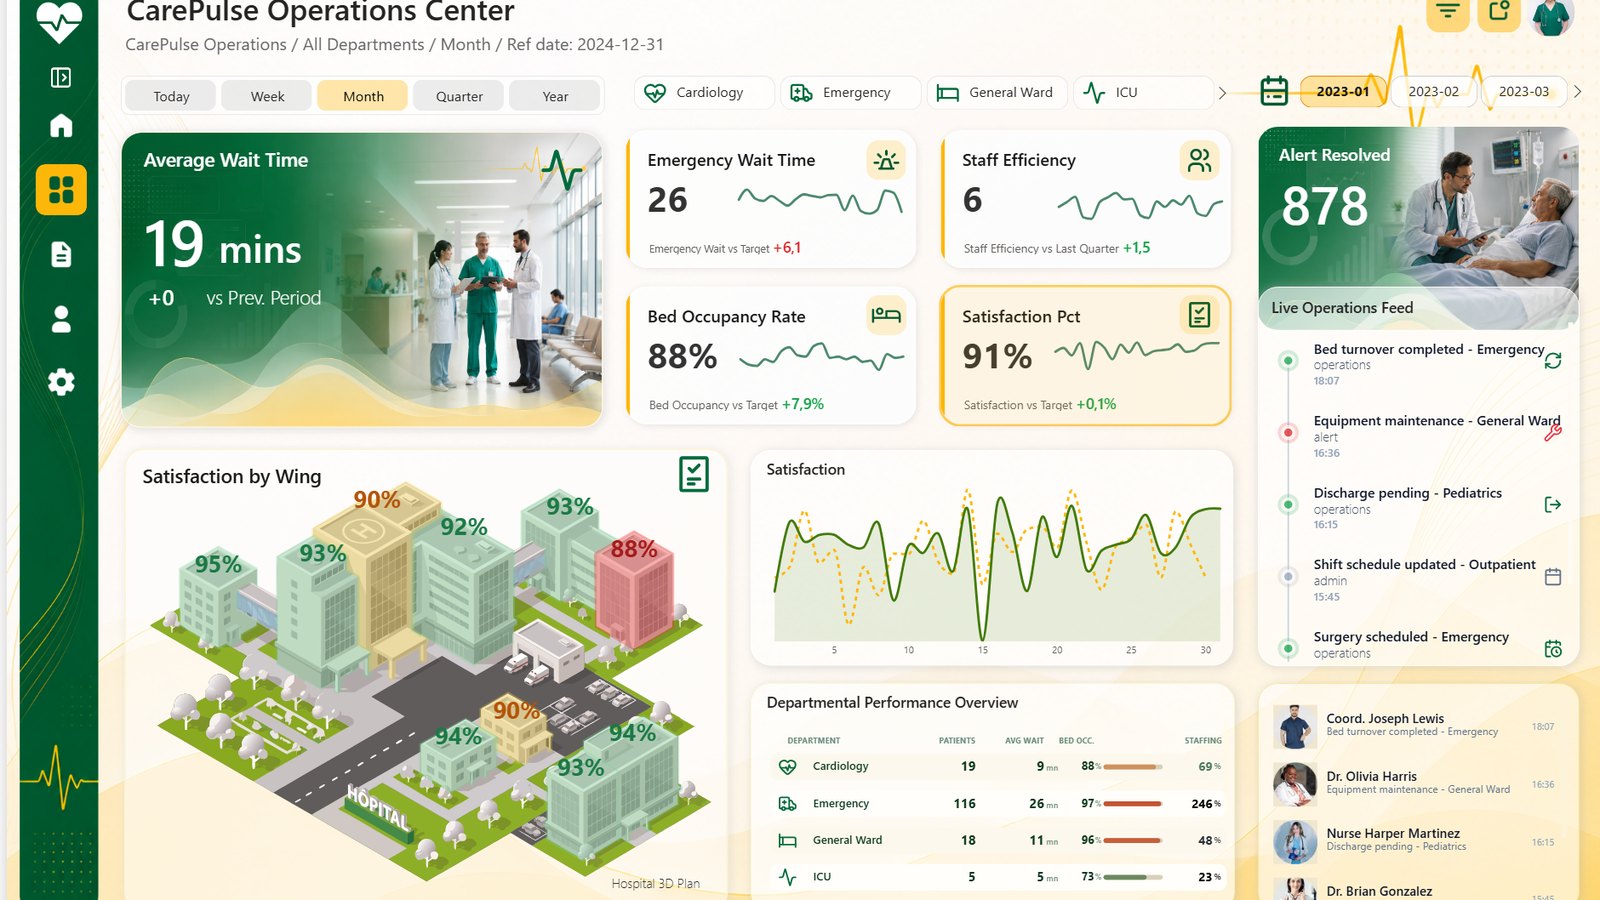
A hospital floor plan as a Power BI map
CarePulse shows hospital operations on the plan of the campus itself: ten wings coloured by wait time, staffing, bed occupancy or satisfaction. A free Power BI report.Maps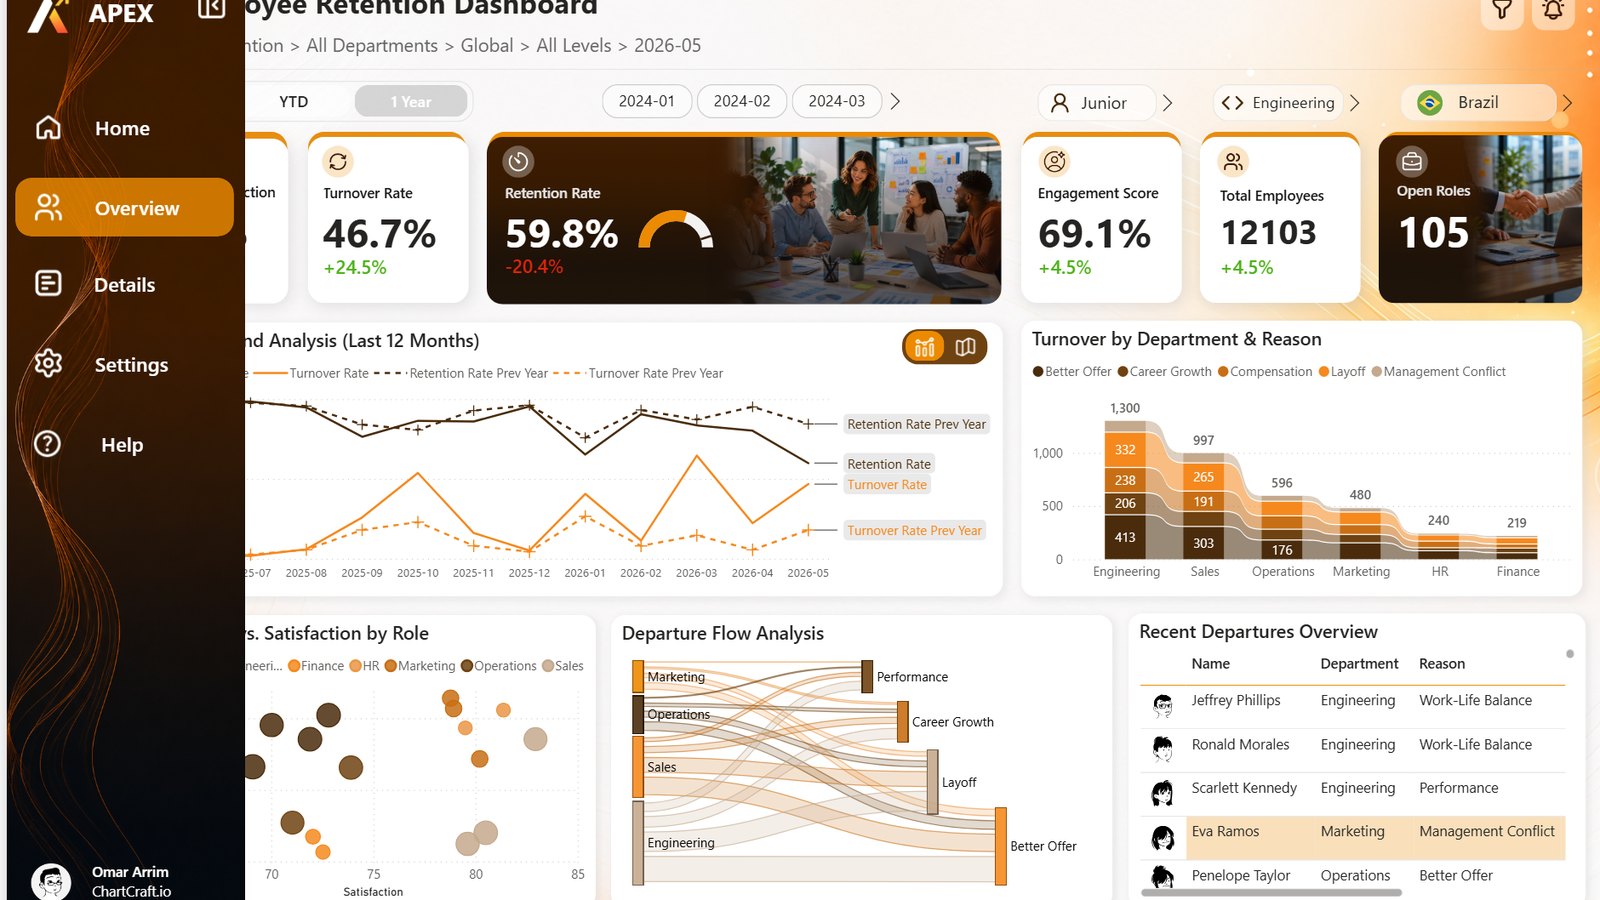 Design techniques22 October 20269 min read
A collapsible sidebar in Power BI: bookmarks that only touch a few visuals
A sidebar that opens and closes, a chart that turns into a map, and not one filter reset. Two bookmark settings, Selected visuals and Data off, do all of it.Slicers and navigation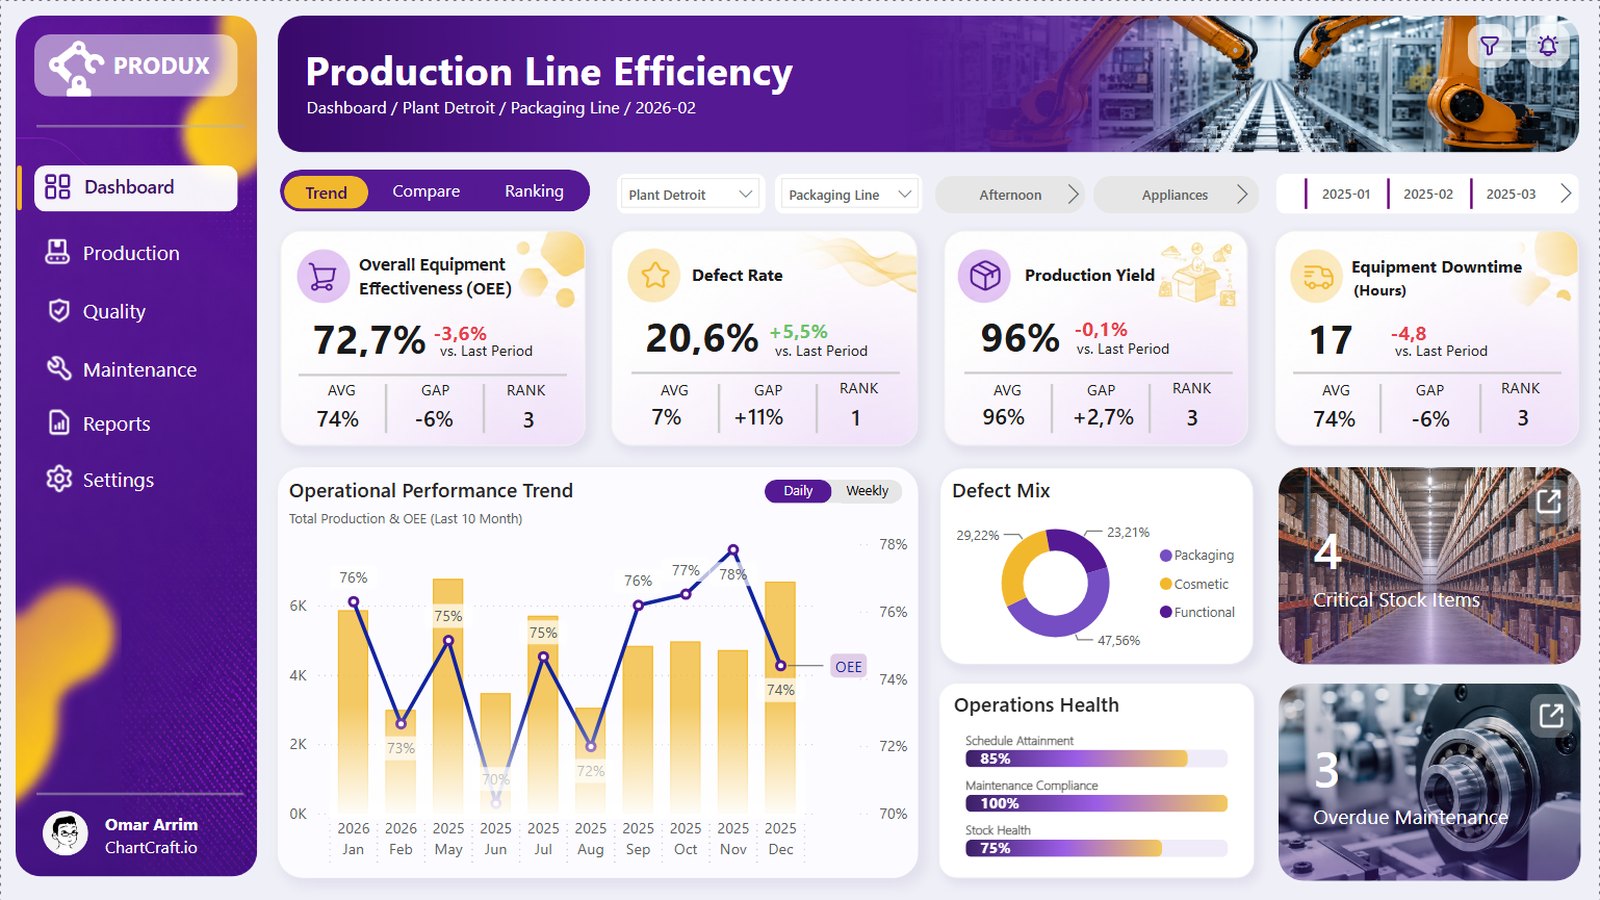 Design techniques22 October 20269 min read