
Design techniques
A Power BI Gantt chart you can click, hover and drill into, with no custom visual
Each row of this Gantt is a native table row drawn by an SVG measure. So it selects, shows a report page tooltip and drills through, with no custom visual.
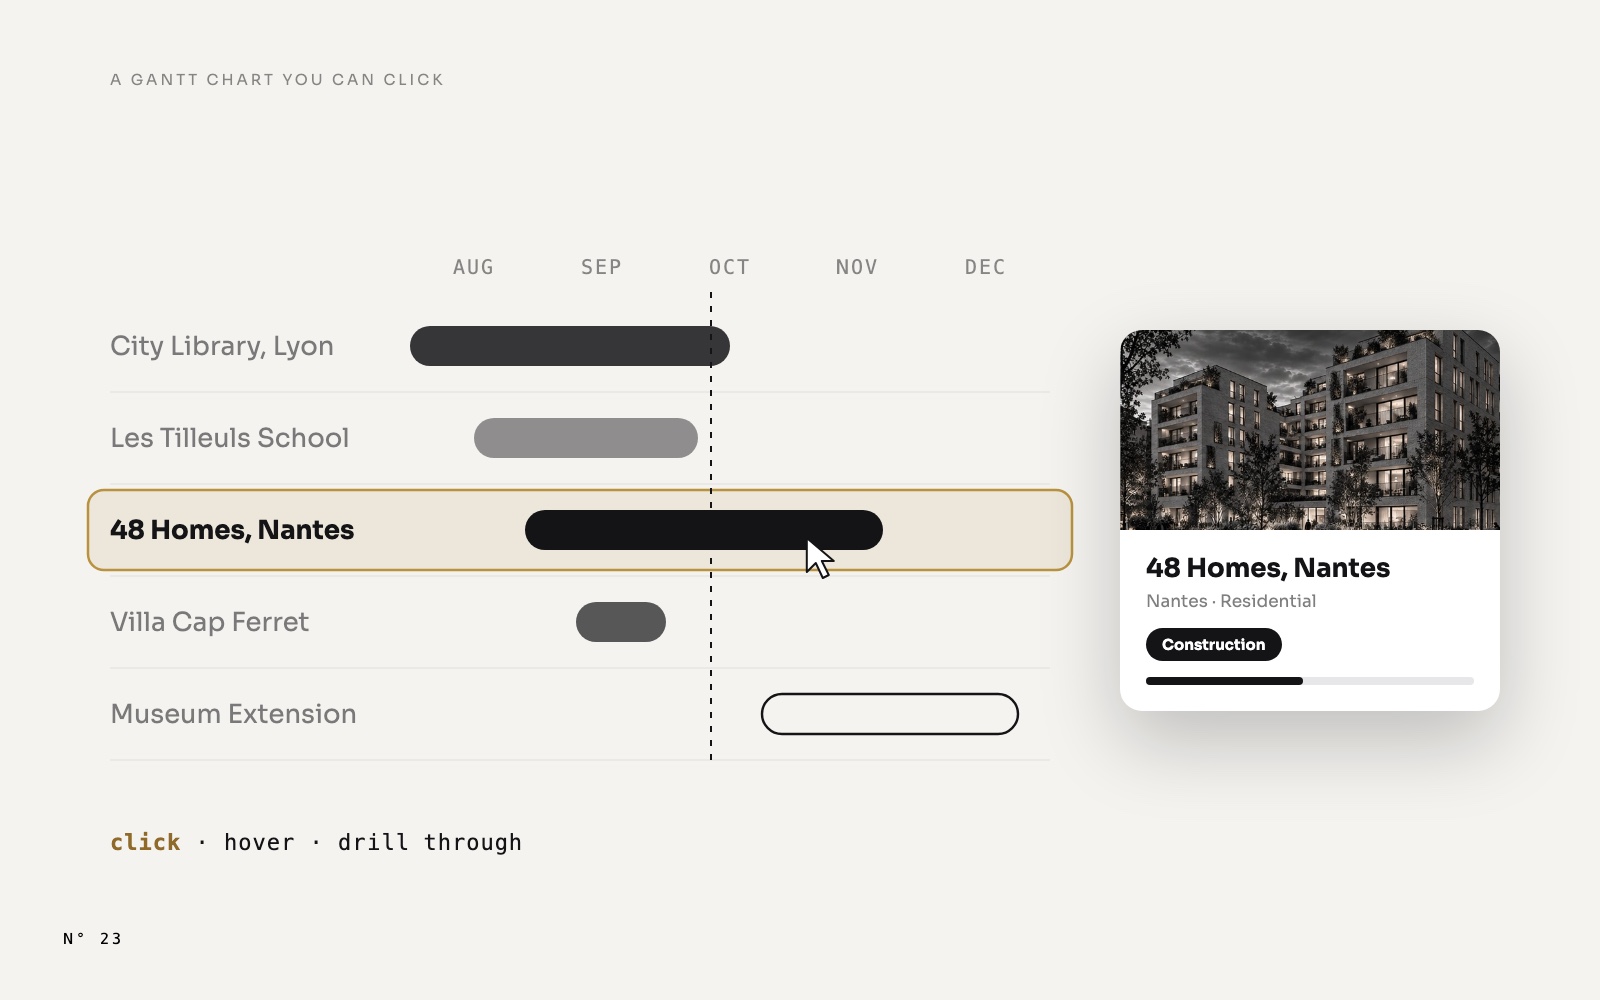
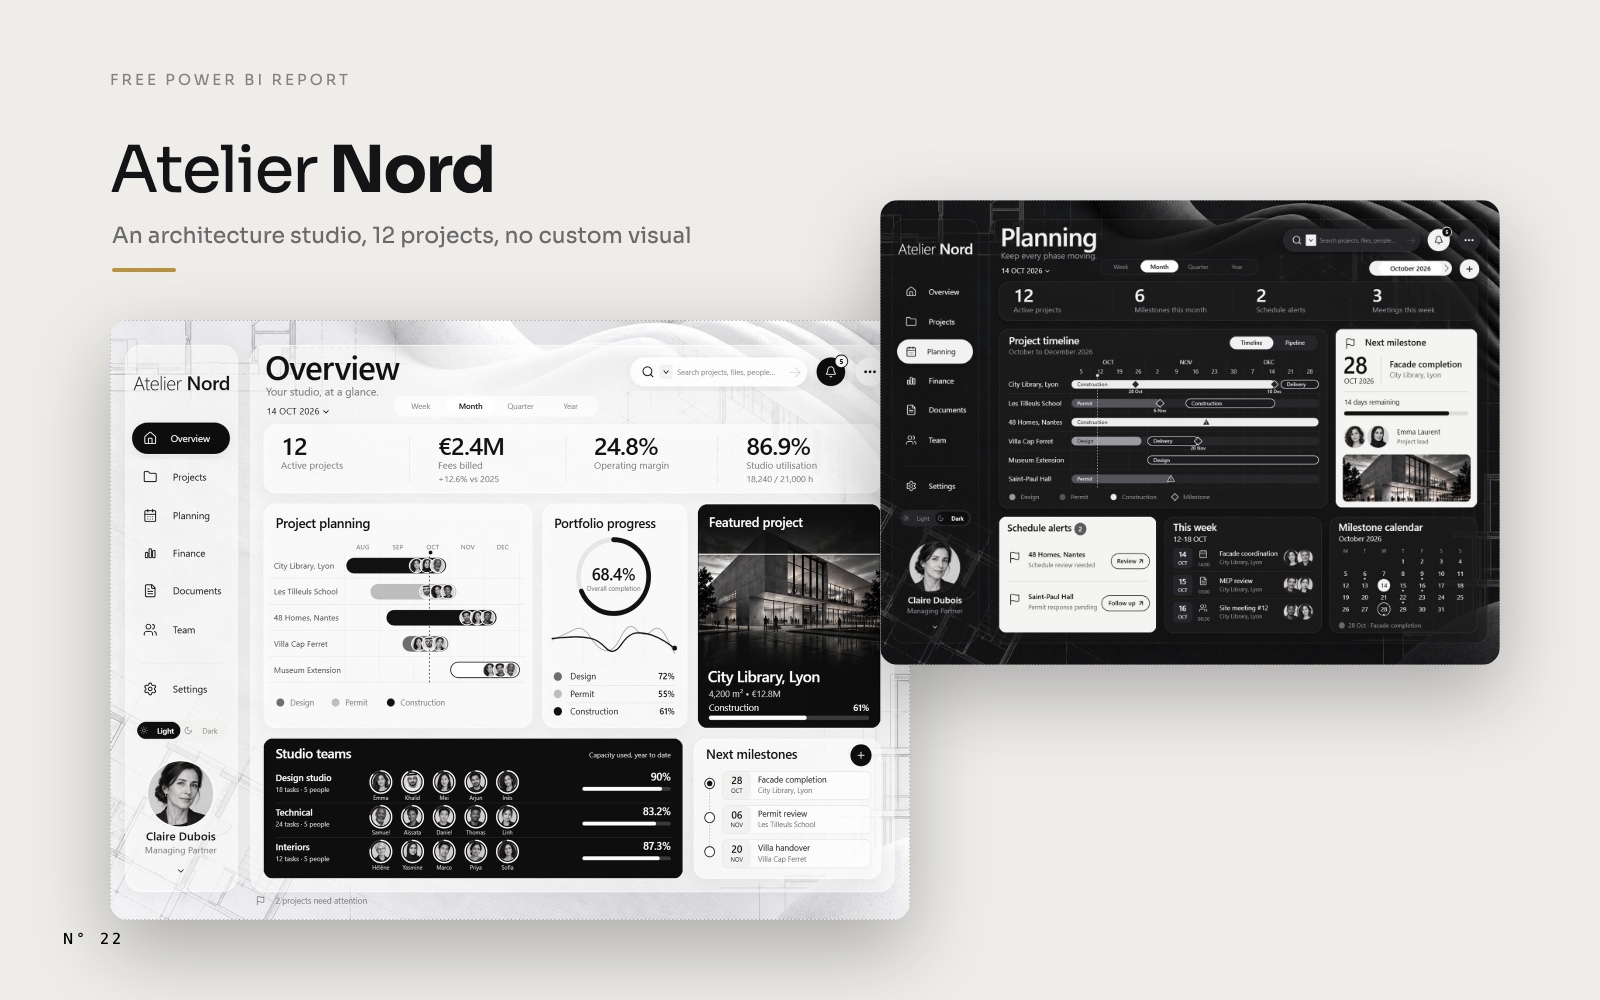
Open Atelier Nord, a free Power BI report for an architecture studio, and look at the Project planning card. Five projects, their phases, their teams, and a dotted line for today. Now use it like an app:
- Click a project. The Featured project card and the studio teams switch to it.
- Hover a project. A card shows up with its render, its phase, its budget, its hours, its next milestone and its team.
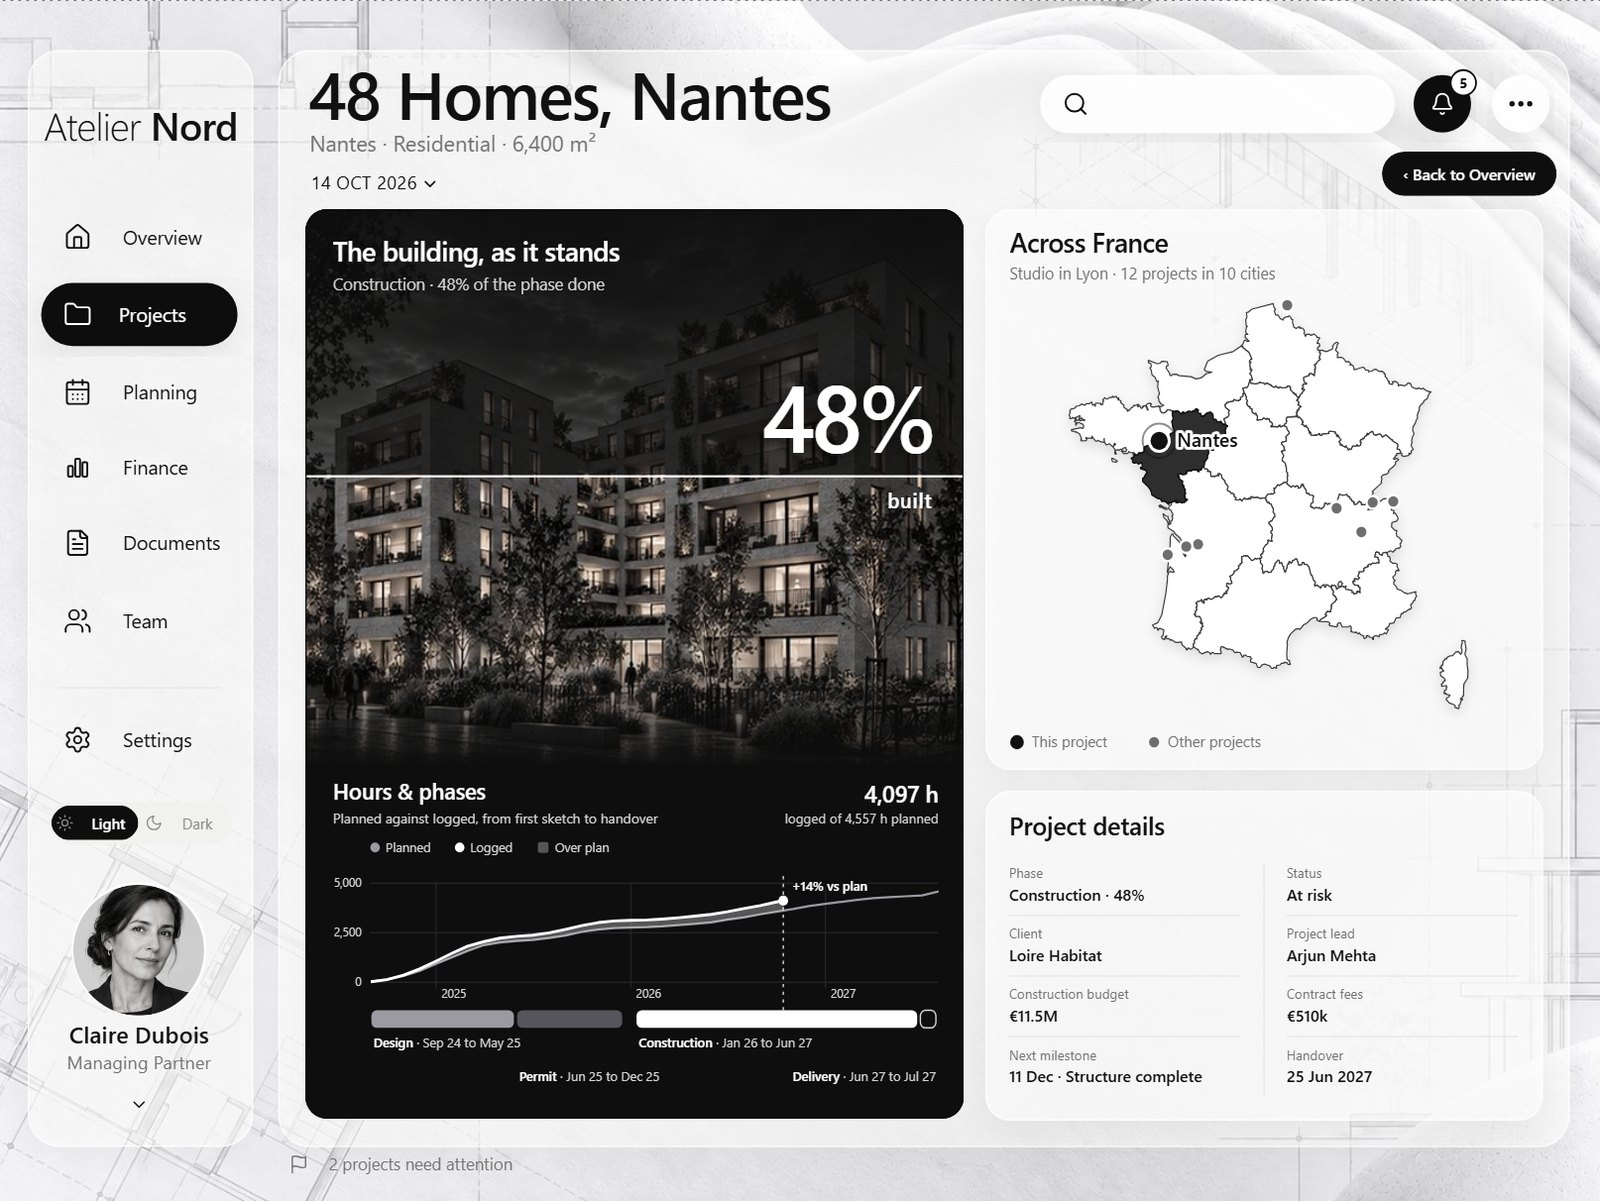
- Right-click a project, Drill through, Project. A full page opens on that project, with a Back button.
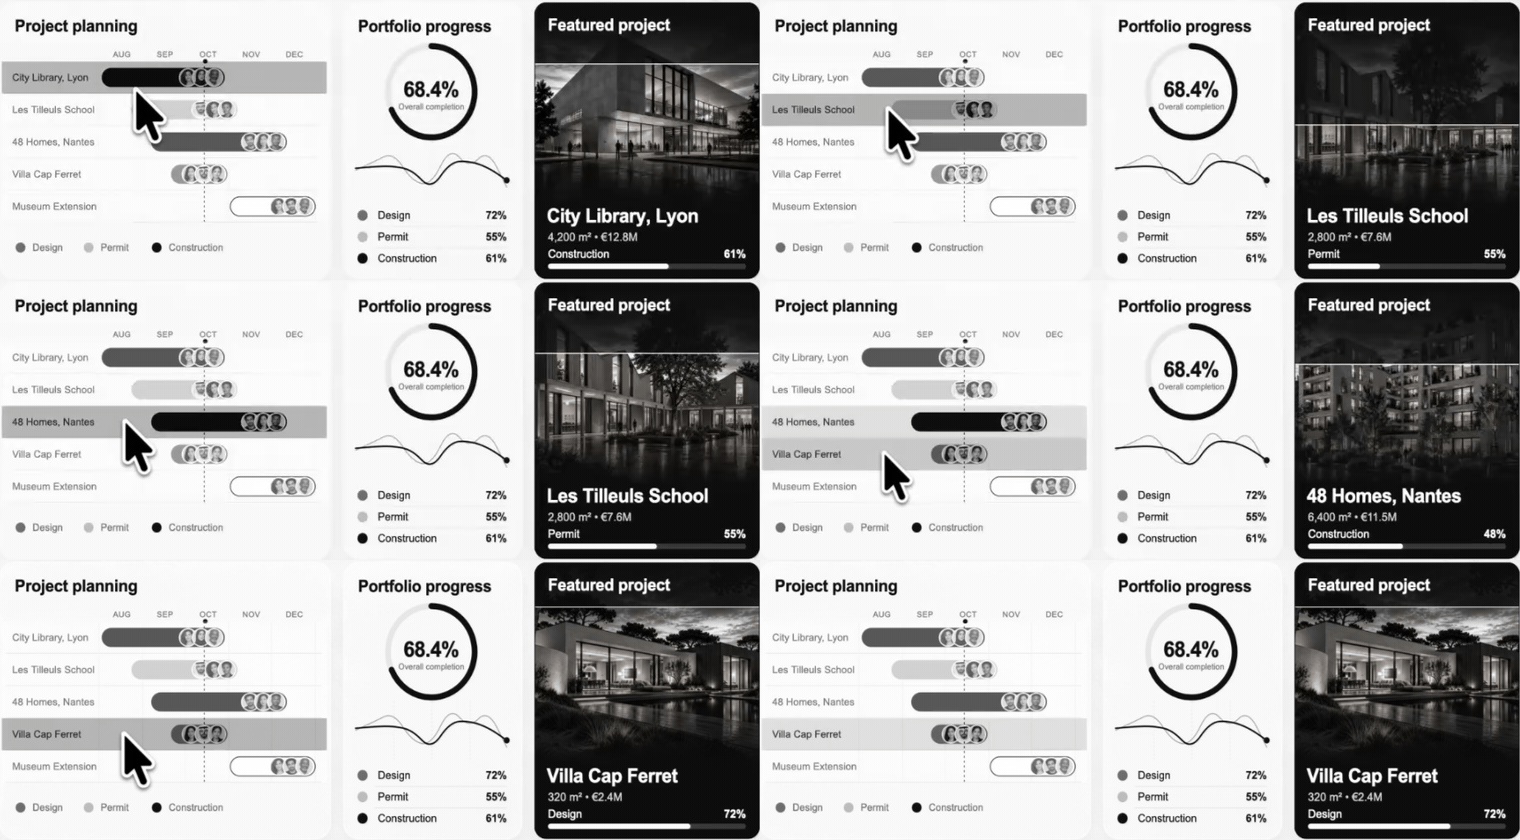
There is no custom visual in the report. The Gantt is a native table, and each of its rows is an image drawn by a DAX measure. That is the whole trick, and it is worth explaining, because it gives you three things a drawing usually can't have.
The limit it removes
In Aurum Jet, our previous free report, every chart is an SVG image returned by a measure and shown in a card. It looks like anything you want. But we had to write it down as a limit: a drawing is an image. You can't hover a bar for a tooltip, and you can't click a route to filter the page.
A card shows one image for the whole visual. It has no rows, so it has no data points: nothing to select, nothing to hover, nothing to drill from.
A table has rows. Put the drawing inside the rows, one image per project, and each image becomes a data point again.
The idea in one sentence
The Gantt is a tableEx with one row per project, and the only column you can see is an SVG measure that draws that project's bar; because the row carries the project, Power BI gives it selection, the report page tooltip and drill-through for free.
The table rows as cards article shows the base technique on a list. This one adds the three interactions, and an axis that lines up with the bars.
The anatomy: three columns, one visible
The visual has three fields, in this order:
| Field | Width | Its job |
|---|---|---|
DimProject[Project] | 1 px | Makes each row a project. Selection, tooltip and drill-through all filter on it. Its text is the colour of nothing. |
[Gantt row overview (SVG)] | 473 px | Draws the row: name, phase bars, avatars, today line. Category Image URL. |
[Gantt order overview] | 1 px | Sorts the rows, and returns BLANK for the projects you don't want to show. |
A few settings make the table disappear behind its rows:
- The image size.
grid.imageWidth = 461andgrid.imageHeight = 47: the exact size of the SVG. The column is 12 units wider than the image, so the cell's inner margin doesn't crop its right edge. - No padding, no grid.
rowPadding 0, horizontal and vertical gridlines off, no outline, totals off. - Transparent cells. The cell and header colours are
#FFFFFF00, white with an alpha of zero. The glass card behind the table shows through, and the rows sit on it like drawn content. - Hidden rows. The sort measure only returns a value for the first five projects. A table hides a row whose measures are all blank, so the card shows five rows and never a sixth half-cut one.
Gantt order overview =
VAR _o = IF ( HASONEVALUE ( DimProject[ProjectKey] ), MAX ( DimProject[GanttOrder] ) )
RETURN IF ( _o <= 5, _o )
The SVG measure checks the same order and returns BLANK when it is blank, so both measures agree on which rows exist.
One row, drawn by a measure
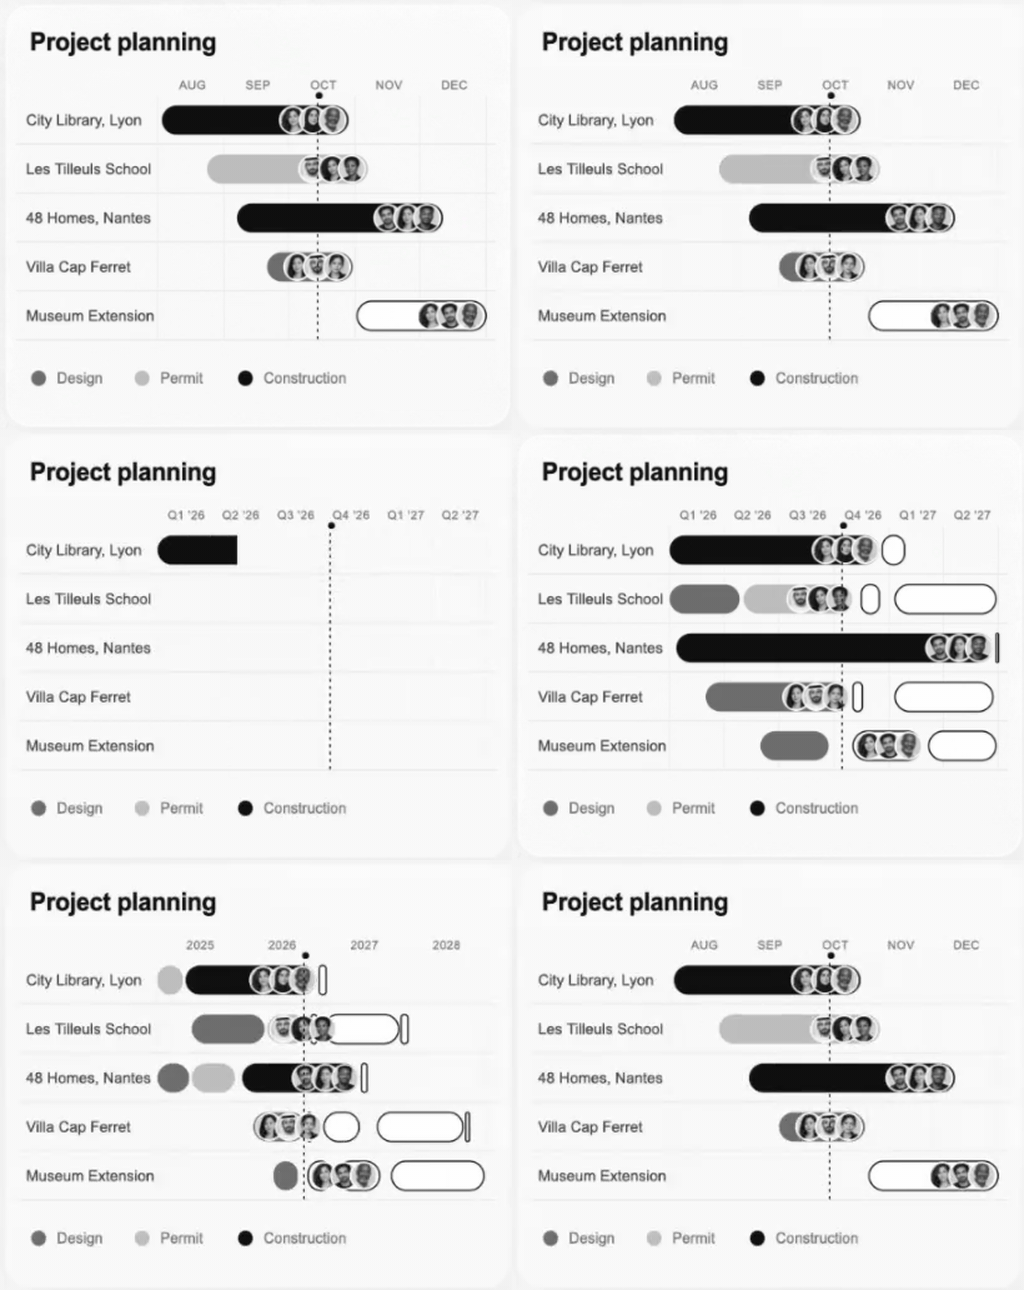
Each row is a 461 × 47 SVG. The time window comes from a Timescale slicer (Week, Month, Quarter, Year) around the report's "now", 14 October 2026. In Month, the Overview shows August to December.
Everything on the row uses one scale: a date becomes an x position with the same expression, everywhere.
-- 136: where the bars start, after the project name
-- 316: the width of the time window, in SVG units
x = 136 + ( _date - _ws ) / _n * 316
_ws is the window start and _n its length in days. The measure then builds the row in layers:
VAR _xy = ADDCOLUMNS ( _vis,
    "@x1", 136 + ( [@a] - _ws ) / _n * 316,
    "@x2", 136 + ( ( [@b] + 1 ) - _ws ) / _n * 316 )
VAR _barres = CONCATENATEX ( _xy,
    VAR _w = MAX ( [@x2] - [@x1], 2 )
    VAR _futur = [@s] > _r
    VAR _c = SWITCH ( [@ph], "Construction", _c_construction, "Design", _c_design, "Permit", _c_permit, _c_design )
    RETURN "<rect x='" & FORMAT ( [@x1], "0.0", "en-US" ) & "' y='9.5' width='" & FORMAT ( _w, "0.0", "en-US" )
        & "' height='28' rx='" & FORMAT ( MIN ( 14, _w / 2 ), "0.0", "en-US" )
        & IF ( _futur, "' fill='" & _c_future & "' stroke='" & _c_ink & "' stroke-width='1.4'/>",
                       "' fill='" & _c & "'/>" ),
"", [@s], ASC )- The segments are cut to the window.
_viskeeps the phases that overlap it, with@a = MAX ( start, window start )and@b = MIN ( end, window end ). A phase that started in 2025 begins at the left edge. - Past and future look different. A phase that hasn't started yet is drawn as an outline, the others are filled with the colour of their phase.
- The colours are measures.
_c_construction,_c_inkand the others read the theme slicer, so the same row works in Light and Dark. The method: Light and Dark mode in Power BI. - The project name is in the image. That way the whole row is one picture, and a click anywhere on it, name included, selects the project.
Then come the three team avatars at the end of the bar (portraits from a base64 table, clipped to circles) and the today line.
A today line that doesn't break between rows
The dotted today line runs through all the rows. But each row is a separate image, and a dash pattern restarts at the top of every image: the dashes would not line up. The fix is to shift each row's pattern by the height of the rows above it:
"<line x1='" & _xt & "' y1='0' x2='" & _xt & "' y2='47' stroke-dasharray='3 4'"
    & " stroke-dashoffset='" & MOD ( ( _o - 1 ) * 47, 7 ) & "'/>"
The pattern is 7 units long (3 drawn, 4 blank). Row _o starts ( _o - 1 ) × 47 units below the first, so its dashes start that far into the pattern. Seen together, the five images draw one continuous line.
Rows that unroll one after the other
Each row's bars sit in a clip path whose width grows from 0, and each row starts a little later than the one above:
VAR _debut = 0.15 + 0.08 * ( _o - 1 )
...
"<clipPath id='r'><rect x='132' y='0' width='0' height='47'>"
    & "<animate attributeName='width' from='0' to='328' begin='" & FORMAT ( _debut, "0.00", "en-US" )
    & "s' dur='0.9s' fill='freeze' calcMode='spline' keyTimes='0;1' keySplines='0.22 1 0.36 1'/></rect></clipPath>"
The avatars fade in 0.55 s after their row starts. Change the timescale and every row replays. The pattern behind it, rank times step, is in staggered SVG animations.
The axis: a card laid over the header
The month labels are not in the rows. They are a separate SVG measure, [Gantt axis (SVG)], shown in a card placed exactly on top of the table's header row. It does two jobs:
- It shows the axis. AUG, SEP, OCT, NOV, DEC, centred on each month, with a dot on today.
- It covers the header. The table header is still there, transparent, and a click on it would sort the table. The card sits on top and takes the click.
To line up, the axis must use the same scale as the rows. It does: same window measures, same 136 + ( d - _ws ) / _n * 316, same 461-unit width. One thing is not obvious. The image in a table cell starts 8 units to the right of the table's edge: the 1 px first column plus the cell's inner margin. So the axis card is placed at the table's x plus 8:
| Visual | x | y | width |
|---|---|---|---|
| Gantt table | 278.5 | 397.3 | 489 |
| Axis card | 286.5 | 397.3 | 461 |
We measured that offset by drawing a red tick at the same date in a row and in the axis, then moving the card until both ticks fell on the same column of pixels.
Click: the row filters what you choose
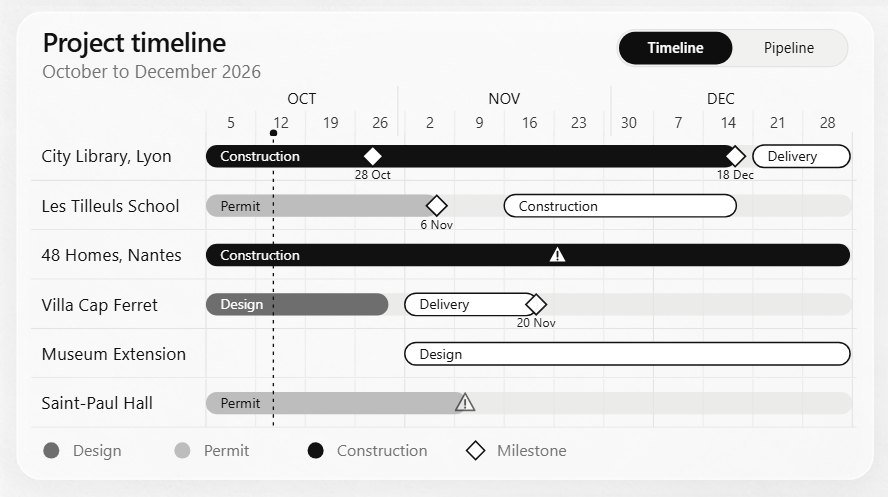
A row is a data point, so a click selects it, and the selection filters the other visuals of the page. Then you choose which ones should follow. In Atelier Nord, the Gantt filters the Featured project card and the Studio teams card. Every other visual on the page ignores it: in the page's visualInteractions, each pair is set to NoFilter.
{ "source": "<gantt>", "target": "<kpi band>", "type": "NoFilter" }In Desktop, that is Format > Edit interactions, then the "None" icon on each visual that should not move.
The Featured card shows the selected project, or a default one when nothing is selected:
Shown project key =
IF ( HASONEVALUE ( DimProject[ProjectKey] ),
    VALUES ( DimProject[ProjectKey] ),
    VAR _t = TOPN ( 1, CALCULATETABLE ( DimProject, DimProject[Status] <> "Completed" ), DimProject[RegisterOrder], ASC )
    RETURN COALESCE ( MAXX ( _t, DimProject[ProjectKey] ), 1 ) )
Every measure of the card (its render, its name, its surface, its budget, its progress) starts from [Shown project key]. Click 48 Homes and they all switch. Click it again and they go back to City Library.
Hover: a report page as the tooltip
The default tooltip of a table cell shows its value. For an SVG measure, that value is the SVG text, a few thousand characters of <rect x=…. Not what you want to show a partner.
A report page tooltip replaces it. Atelier Nord has a hidden page named Project card, 360 × 270, set as a tooltip page. It holds one card, another SVG measure: the render, the phase and its progress, the budget, the fees, the hours, the next milestone and the team. The Gantt points to it in its format settings, General > Tooltips: type Report page, page Project card.
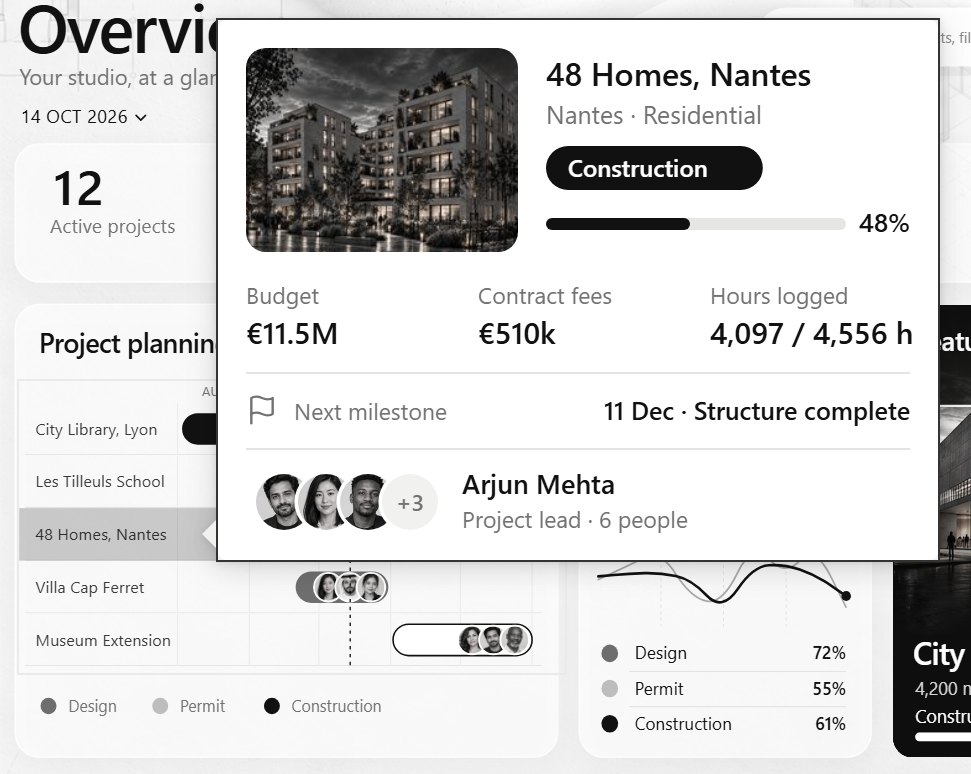
When you hover a row, Power BI filters the tooltip page on the row's fields. That is why the 1 px DimProject[Project] column matters: it is the filter the card receives. The page also receives the theme from the page you came from, so the card is dark when the report is.
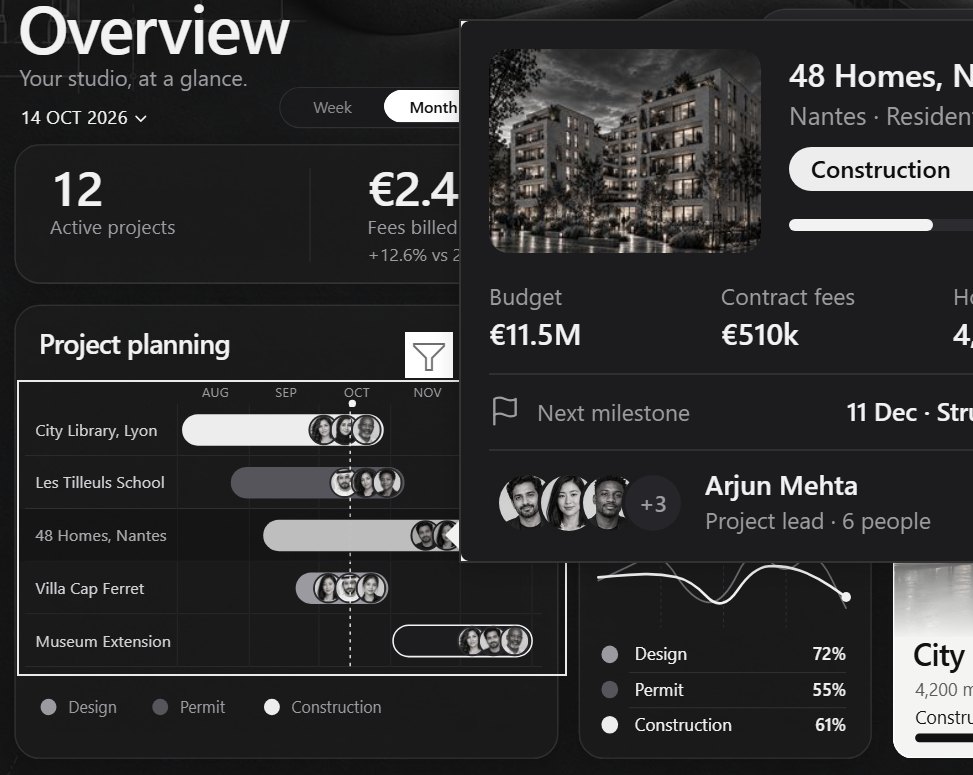
In the PBIR files, the page has "type": "Tooltip" and the table carries the link:
"visualTooltip": [ { "properties": {
  "show":    { "expr": { "Literal": { "Value": "true" } } },
  "type":    { "expr": { "Literal": { "Value": "'Canvas'" } } },
  "section": { "expr": { "Literal": { "Value": "'<id of the Project card page>'" } } }
} } ]
'Canvas' is the internal name of a report page tooltip.
Drill through: a page for the project
The third interaction opens a full page. The hidden page Project is a drill-through page on DimProject[Project]: right-click any row, Drill through > Project, and it opens filtered on that project, with a Back button in its corner.
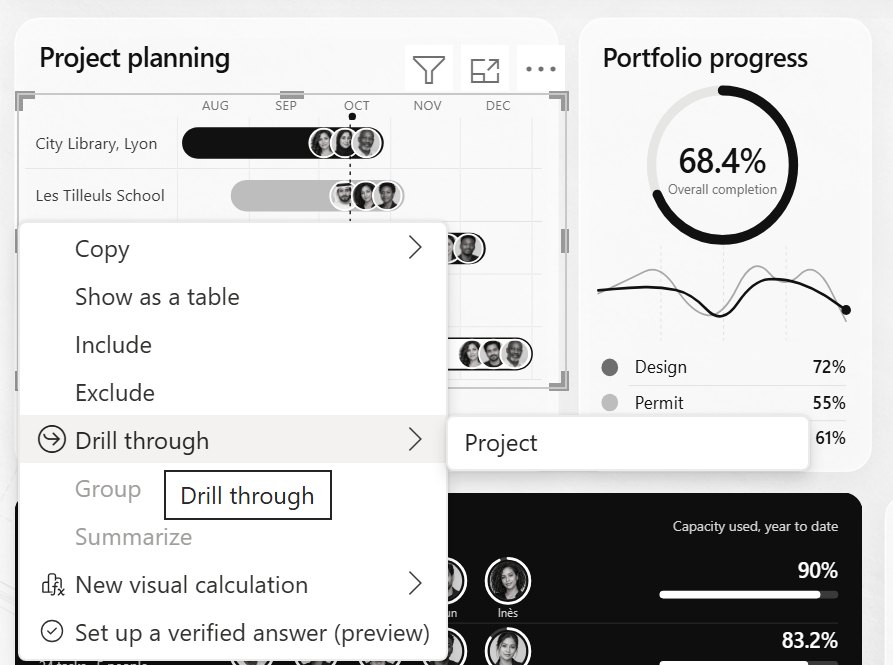
Two settings make it work well:
- Turn off "Keep all filters". With it on, the page also receives every other filter of the source page, the theme included, and its own theme slicer gets stuck on one value. With it off (
acceptsFilterContext: "None"in the page binding), only the project goes through. The theme reaches the page through a synced slicer instead. - A button for people who don't right-click. On the Projects page, an Open project button is a drill-through action to the Project page. It stays greyed out until a row is selected, then opens that project.
The same field everywhere
The Gantt is not alone. Atelier Nord has five tables built this way: the two Gantts, the project register, the profitability table and the invoices. Each one is a native table with rows drawn by an SVG measure and DimProject[Project] as its first column. The invoices table adds the invoice number as a second 1 px column, so it shows one row per invoice, each still tied to its project.
So every one of them gets the same click, the same hover card and the same drill-through, without any extra work. Build the tooltip page and the drill page once, and every table on that field uses them.
Build it in Power BI Desktop
- Write the row measure. An SVG of fixed size, with the project name, the bars computed from the dates, and
dataCategory: ImageUrl. Return BLANK when the row should not show. - Write the sort measure. It returns the display order, or BLANK beyond the last row you want.
- Add a table visual with three fields: the project column, the row measure, the sort measure. Sort by the sort measure.
- Size the table. Image width and height to the SVG size, the row measure column 12 wider, the two other columns 1 px. Row padding 0, no gridlines, totals off.
- Make it transparent. Header and value colours
#FFFFFF00, for the background and the text. - Draw the axis as another SVG measure with the same scale, in a card over the header, 8 units to the right of the table.
- Create the tooltip page: a new page, Page information, Allow use as tooltip, canvas 360 × 270. Then on the table, General > Tooltips > Report page.
- Create the drill page: add
DimProject[Project]to its drill-through well, turn Keep all filters off, keep the Back button. - Set the interactions: Format > Edit interactions, and None on every visual the Gantt should not filter.
The traps
- Two measures with the same display name break the table. We first renamed both the row and the sort measure to a blank
" ". Result: "Error fetching data for this visual". Give them different invisible names: a space, and a zero-width space. - The 8-unit offset. Place the axis at the table's own x and every label sits 8 units to the left of its month. Measure it once, on your own table.
- Keep all filters drags the theme along. See above: turn it off on the drill page.
- A slicer can't start a drill-through. If you pick a project in a slicer, the Open project button stays greyed: "select a single data point". Drill-through starts from a data visual, a table row here.
- In Desktop, Ctrl+click. Buttons only act on Ctrl+click while you edit. In the Service, a plain click works.
- Escape the text. A project or client name with an
&makes the SVG invalid, and the row turns into a broken image. Wrap every text that comes from the data inSUBSTITUTE ( _t, "&", "&" ). - The selected row gets Power BI's own highlight. Desktop dims the rows you didn't click. It reads well on a Gantt, so we kept it.
Try it
- Atelier Nord: download the report, click a row of the Project planning, hover it, drill into it. The measures are
Gantt row overview (SVG),Gantt axis (SVG),Gantt order overviewandProject card (SVG). - The base technique, on a list: table rows as cards.
- How an SVG measure is shown in a visual: SVG measures in Power BI cards.
- The report itself: Atelier Nord, a free Power BI report for an architecture studio.
FAQ
Does it need a custom visual?
No. The Gantt is the native table visual. The bars are SVG images returned by DAX measures.
Can I click a single phase or a single milestone?
No. Power BI shows the SVG as an image, and an image receives no mouse events inside it. The unit you click, hover and drill is the row, so here the project.
How many rows can it show?
As many as the table can. Each row is one SVG, a few dozen kilobytes with its three portraits. The Overview shows five projects, the Planning page six. For a long list, add a scroll or pages: the Projects register uses a page slicer and the sort measure.
Does it work in the Power BI Service?
Yes. We published the report and checked it in the browser: the click, the report page tooltip and the drill-through work as in Desktop, and the Open project button takes a plain click instead of Ctrl+click.
Why not the Gantt custom visual from AppSource?
It works, and it gives you per-bar tooltips. But it is a custom visual: someone may have to approve it, and its look is its own. This one is a few measures you control, it follows the report's theme, and it opens wherever Power BI opens.
Part of a series
Atelier Nord · article 2 of 4
- Atelier Nord: a free Power BI report for an architecture studio
- A Power BI Gantt chart you can click, hover and drill into, with no custom visual
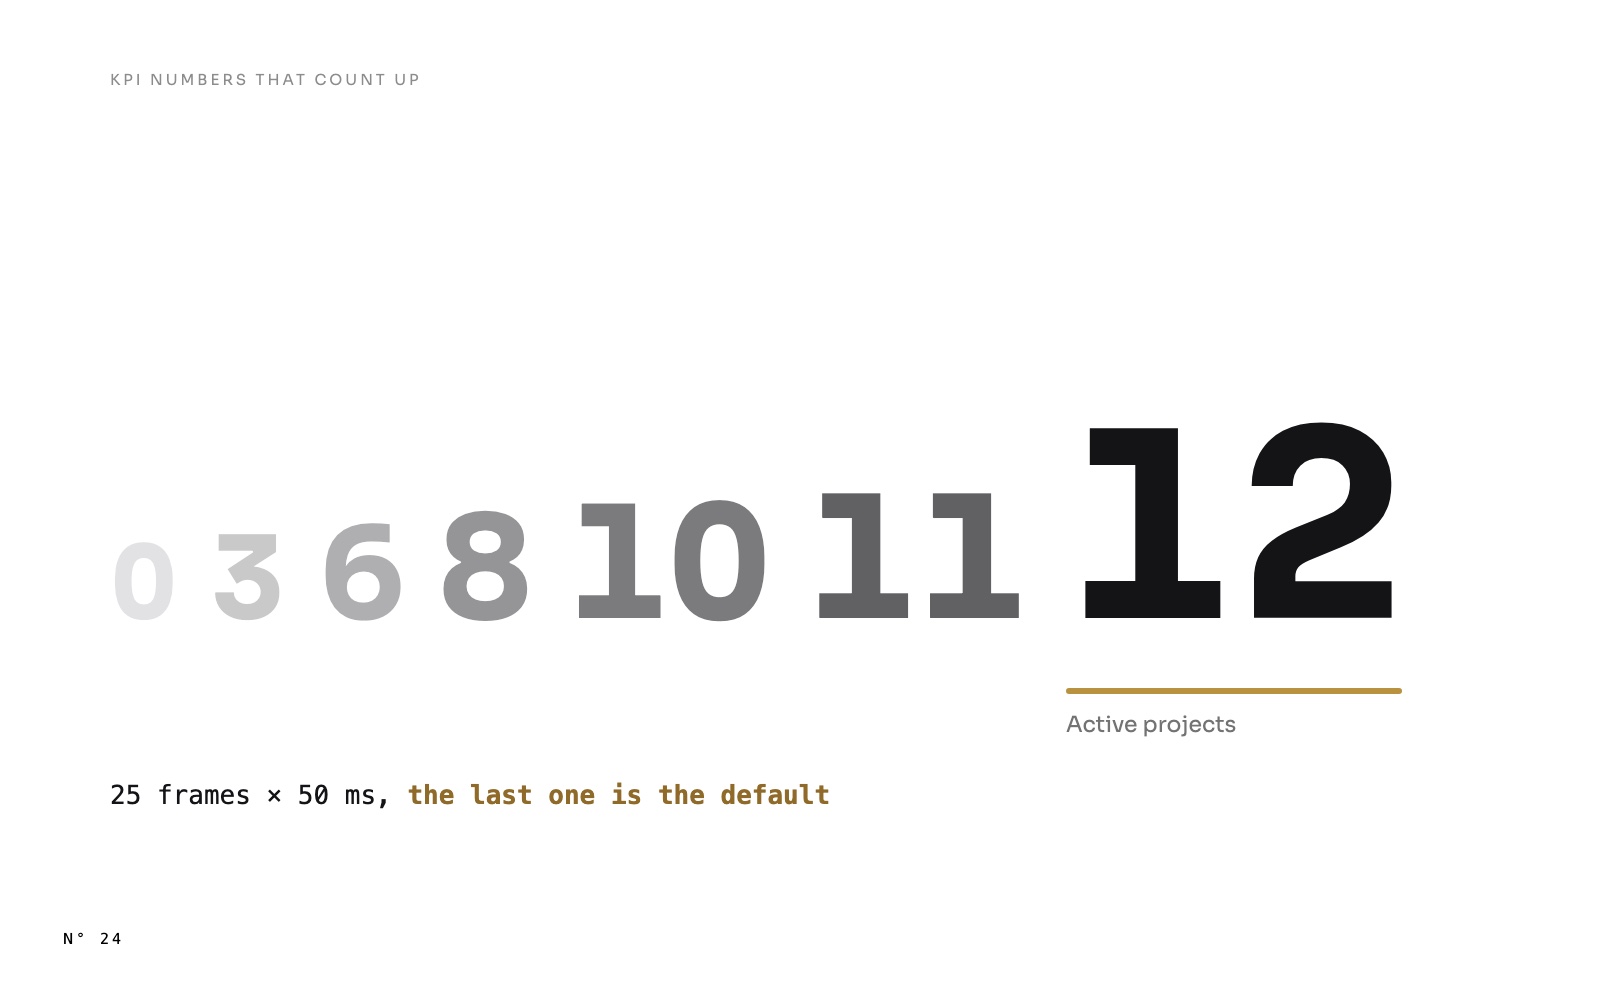
- KPI numbers that count up in Power BI, with one DAX measure
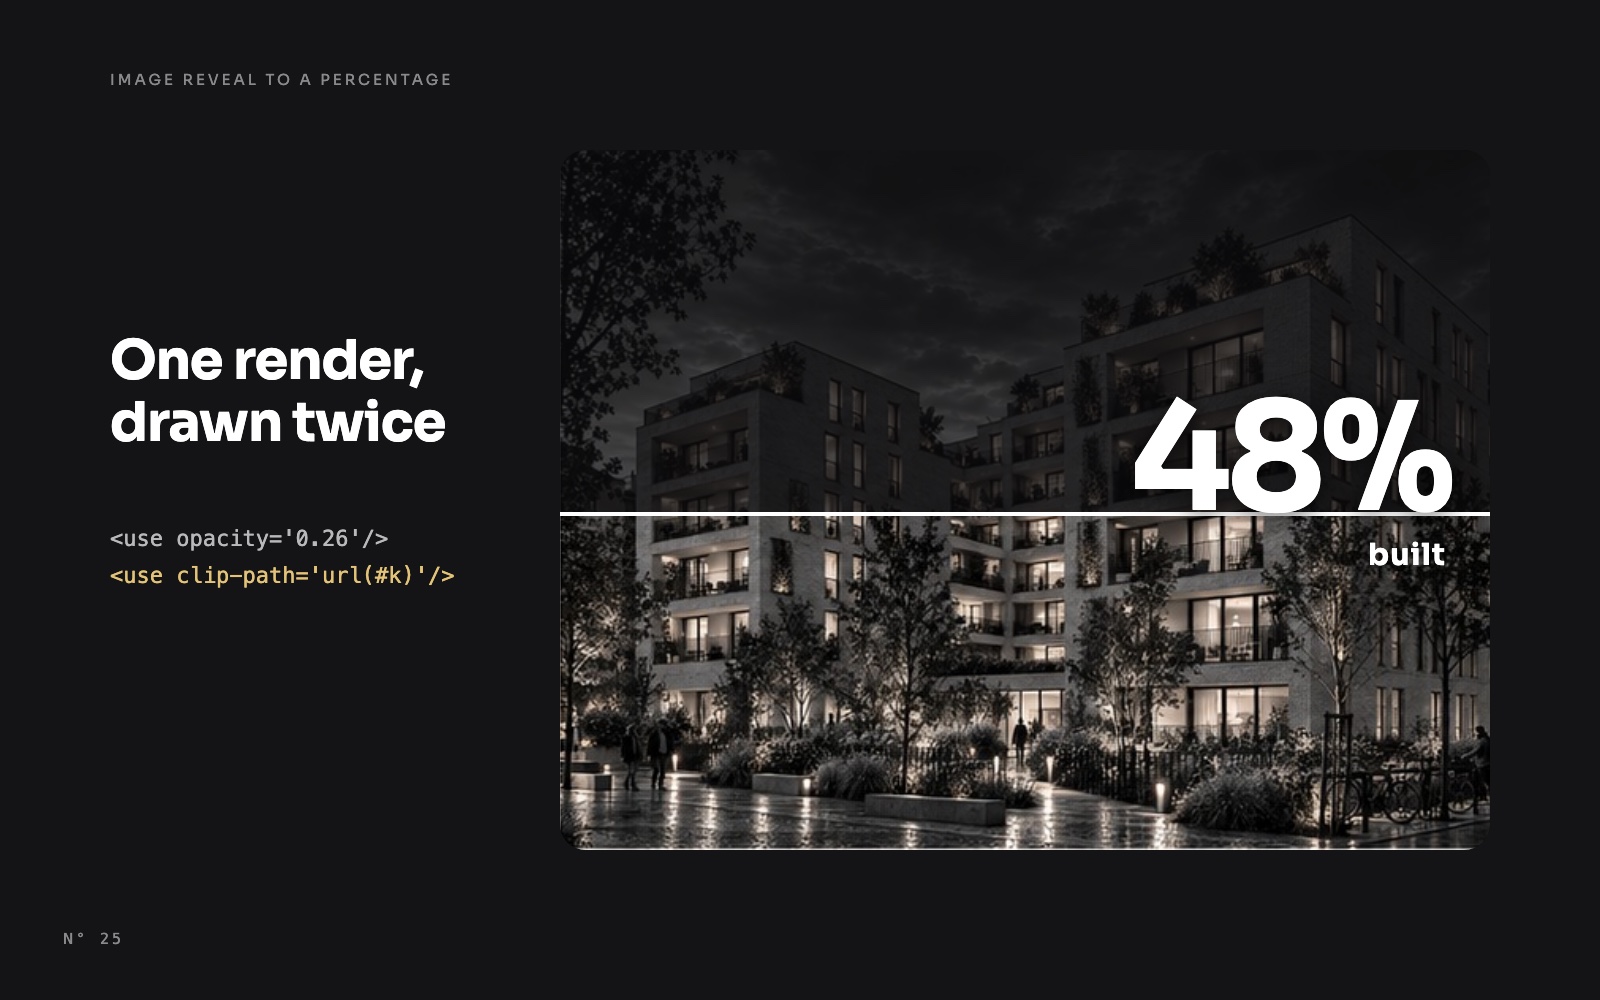
- A building that rises to its progress: an image reveal in Power BI