

Design techniques
KPI numbers that count up in Power BI, with one DAX measure
SVG can't animate a number. So this DAX measure writes 25 versions of it and shows each one for 50 ms: KPIs that count up from zero, in any native card.
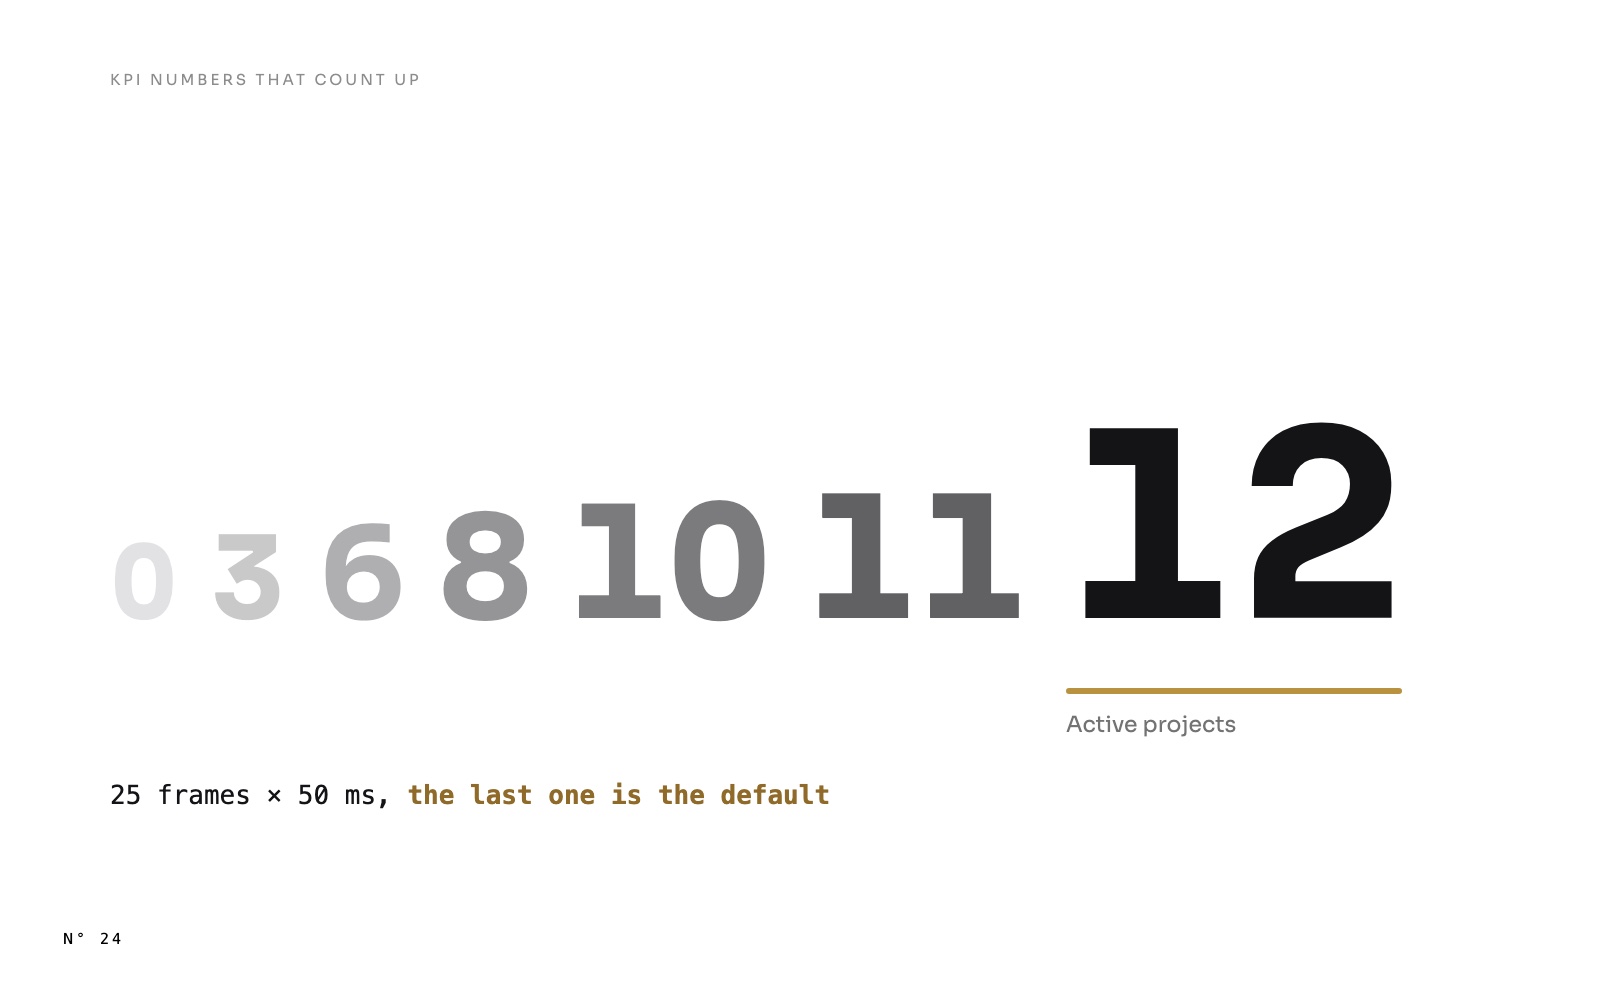
Open any page of Atelier Nord, a free Power BI report, and watch the KPIs at the top. They don't appear: they count. 0, 3, 6, 9, 12 active projects. €0.8M, €1.6M, €2.2M, up to €6.8M of fees. 8.2 %, 15.7 %, 22.6 %, up to 68.4 % of completion. The count is fast at first, slows down at the end, and lands on the value in a little over a second.

It is a classic of web dashboards, and Power BI has no setting for it. This article shows how one SVG measure does it, why the obvious approach doesn't work, and the one detail that keeps the number right in every screenshot and export.
Why you can't just animate the number
The KPI band is an SVG image returned by a DAX measure and shown in a native card, as in SVG measures in Power BI cards. SVG can animate a lot: a position, a width, a colour, an opacity, a path. Every bar and ring of Atelier Nord grows that way.
But SVG can't animate the text of a <text> element. There is no <animate attributeName='textContent' from='0' to='12'>. On a web page, a few lines of JavaScript would change the number 60 times a second. A Power BI image runs no JavaScript.
So the measure does what a flip book does. It writes every frame in advance, and the animation only decides which frame is visible.
The idea: 25 frames, one visible at a time
For each KPI, CONCATENATEX over GENERATESERIES ( 0, 24 ) writes 25 <text> elements, all at the same place. Each one holds the value at that point of the count, and two <set> elements switch its opacity: on at its start time, off 50 ms later.
CONCATENATEX ( GENERATESERIES ( 0, 24 ),
    VAR _e = 1 - POWER ( 1 - [Value] / 24, 3 )
    VAR _v = _k0 * _e
    VAR _fin = [Value] = 24
    RETURN
        "<text x='32.5' y='58.5' font-size='46' font-weight='600' fill='" & _c_ink & "'"
        & " style='font-variant-numeric:tabular-nums' opacity='" & IF ( _fin, "1", "0" ) & "'>"
        & FORMAT ( ROUND ( _v, 0 ), "#,0", "en-US" )
        & IF ( _fin,
            "<set attributeName='opacity' to='0' begin='0s'/>"
                & "<set attributeName='opacity' to='1' begin='" & FORMAT ( 0.15 + 23 * 0.05, "0.000", "en-US" ) & "s'/>",
            "<set attributeName='opacity' to='1' begin='"
                & IF ( [Value] = 0, "0", FORMAT ( 0.15 + ( [Value] - 1 ) * 0.05, "0.000", "en-US" ) ) & "s'/>"
                & "<set attributeName='opacity' to='0' begin='" & FORMAT ( 0.15 + [Value] * 0.05, "0.000", "en-US" ) & "s'/>" )
        & "</text>",
    "", [Value], ASC )
_k0 is the KPI's value, here [Active projects]. Line by line:
- The ease-out.
_e = 1 - ( 1 - i / 24 )³goes from 0 to 1, fast at first and slow at the end. Frame 6 is already at 58 % of the value, frame 18 at 98 %. A linear count feels mechanical. This one lands. - The value of the frame.
_v = _k0 × _e, formatted like the final value. For 12 projects, the frames read 0, 1, 3, 4, 5, 6, 7, 8, 9, 10, 11, and 12 from frame 16 on. - The timing. Frame
ishows at0.15 + ( i - 1 ) × 0.05seconds and hides 50 ms later. Frame 0 shows at once. Frame 24 shows at 1.30 s and stays. <set>, not<animate>.<set>changes a value at an instant, with no transition. That is what you want for frames: one disappears exactly when the next appears.
The detail that matters: the last frame is the default
Look at frame 24 again. It is the only one written with opacity='1'. Its first <set> hides it at 0 s, and its second shows it again when the count ends.
Why not write it with opacity='0' like the others, and show it at the end? Because an SVG is not always animated:
- A screenshot or an export may render the image without playing it. Power BI's export to PDF or PowerPoint, a thumbnail, an automated capture.
- A renderer may not run the animation at all.
In all those cases, the image shows the attributes as written. With the last frame visible by default, the KPI reads 12. With all frames hidden by default, it would read nothing, or 0 if frame 0 were the visible one.
Rule: write the end state as the default state, and let the animation take it away and give it back. The same rule applies to every animation in the report. A bar that grows from 0 is written at its full height, with an <animate from='0'>.
Units, decimals, and a number that doesn't shake
Three details separate a count that looks right from one that looks broken.
Format every frame like the final value. Fees of €6.8M count through €0.8M, €1.6M, €2.2M. If each frame chose its own unit, the count would start around €820k and switch to €1.6M at the next frame: the unit would jump in the middle. The measure picks the format once, from the final value, and applies it to every frame:
IF ( ABS ( _k1 ) >= 1000000,
    "€" & FORMAT ( _v / 1000000, "0.0", "en-US" ) & "M",
    "€" & FORMAT ( _v / 1000, "0", "en-US" ) & "k" )
_k1 is the final value, _v the frame's value.
Keep the decimals of the final value. 68.4 % counts as 8.2 %, 15.7 %, 22.6 %, with one decimal all along. 12 projects count in whole numbers: ROUND ( _v, 0 ).
Use tabular figures. In most fonts, a 1 is narrower than an 8. As the digits change, a left-aligned number would get wider and narrower, and a right-aligned one would shake. font-variant-numeric:tabular-nums gives every digit the same width, so only the digits move.
Four KPIs, one after the other
The KPI band holds four values, and they don't start together. Each KPI starts 0.1 s after the one on its left: 0.15 s, 0.25 s, 0.35 s, 0.45 s. The labels under the values fade in and slide up 8 units, 0.1 s after their number starts.
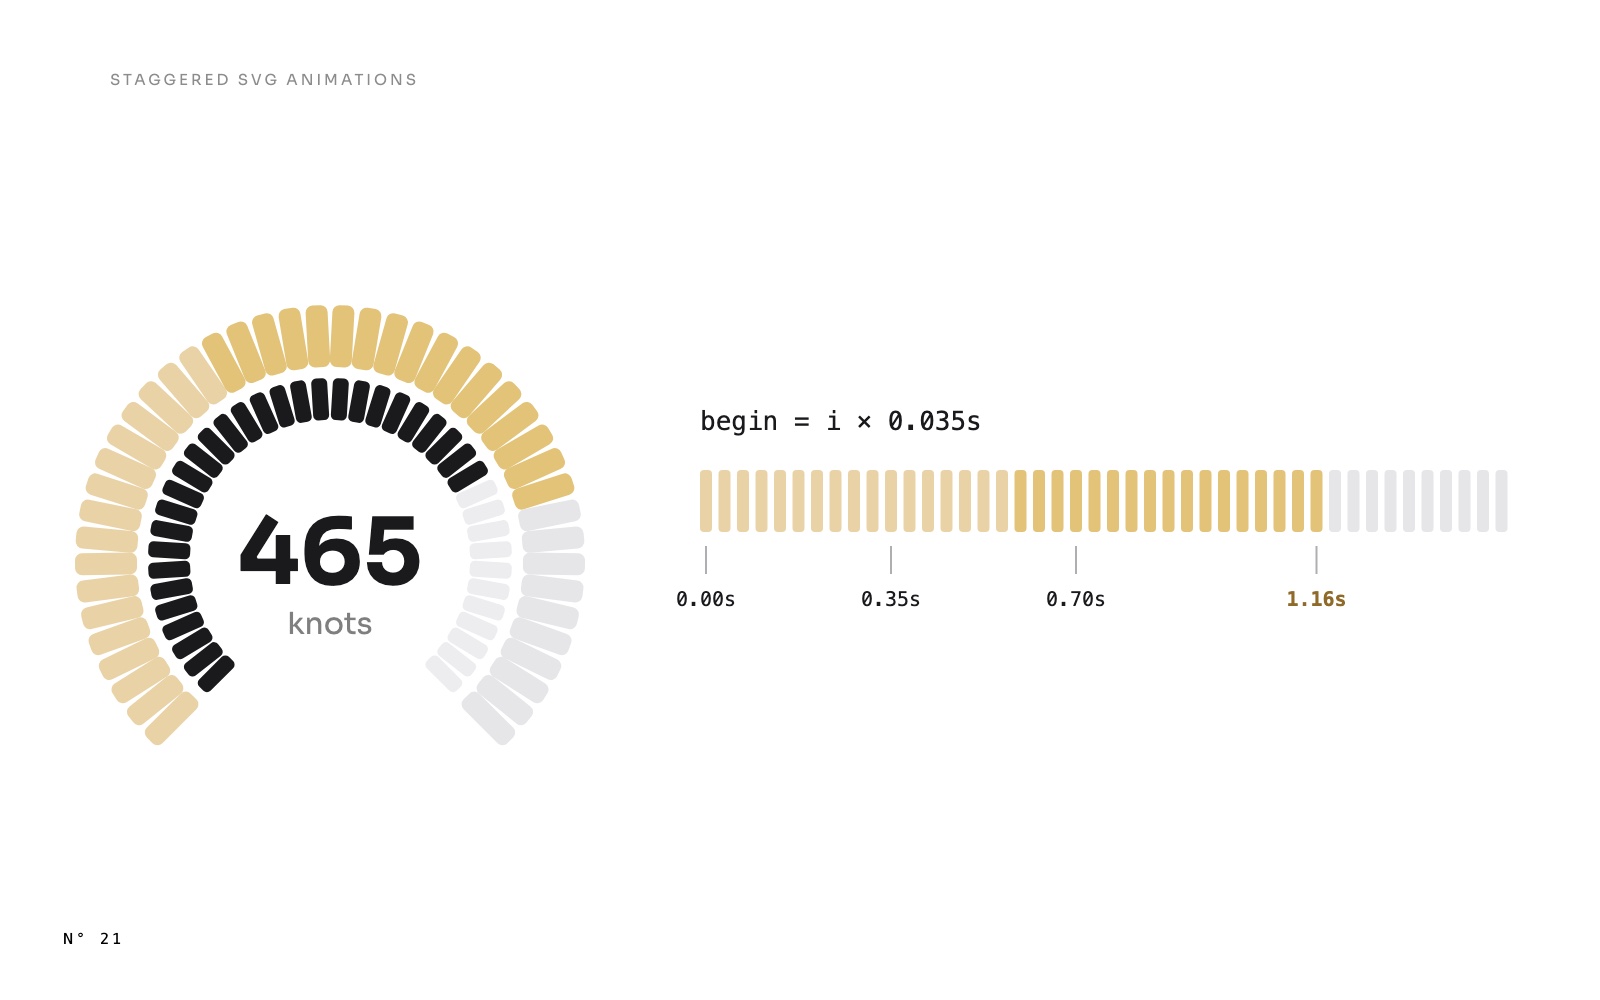
Each count takes a little over a second. With the offsets, the band settles at about 1.6 s. That is the same rule as in staggered SVG animations: short, ordered, overlapping.

When it plays
The count plays each time Power BI draws the image: when the page opens, and each time the text of the measure changes. Change the Finance period from Month to Year, and the four KPIs of the Finance page count again, up to their new values.
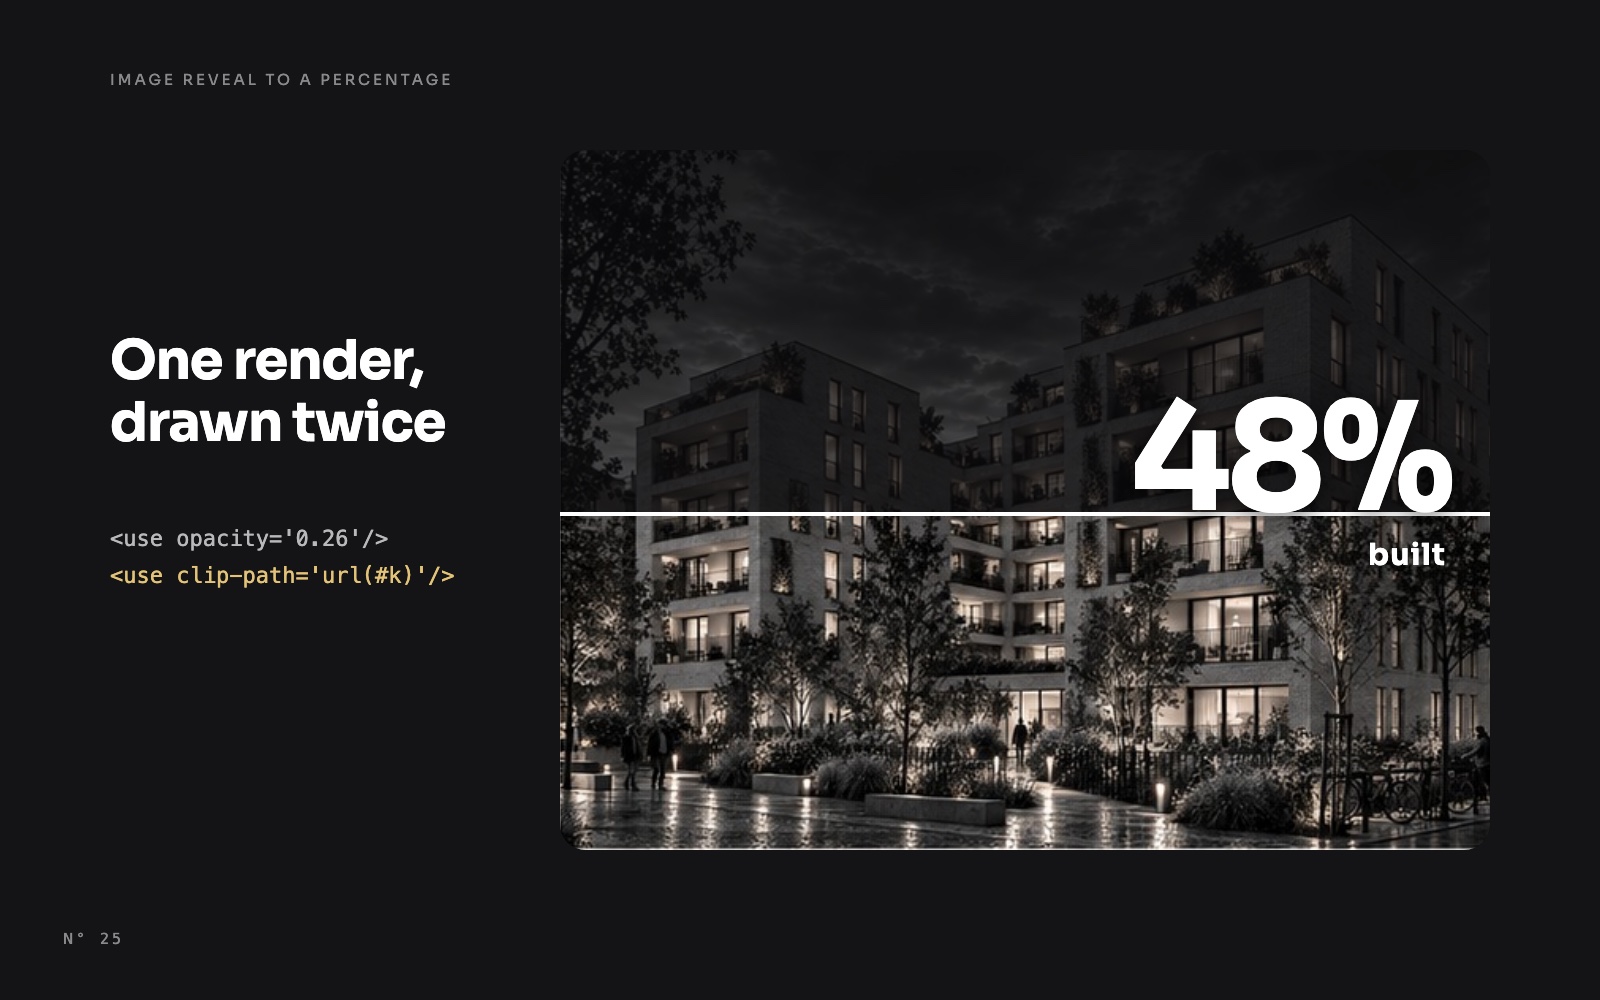
On the project page, the same pattern counts the progress of the building, from 0 % to the share of its phase that is done, while the image rises with it: an image that reveals itself up to a percentage.
Build it in Power BI Desktop
- Start from your KPI card as an SVG measure: the value in a
<text>, the label under it. See SVG measures in Power BI cards for the wrapper and the Image URL category. - Replace the value by the
CONCATENATEXabove, overGENERATESERIES ( 0, 24 ), with your measure as the final value. - Format each frame with the final value's format: same unit, same decimals.
- Add
font-variant-numeric:tabular-numsto the text style. - Write the last frame visible by default, hidden at 0 s and shown at the end.
- Offset each KPI by 0.1 s if the band has several.
The traps
- Times are in seconds, with a dot.
FORMAT ( …, "0.000", "en-US" ) & "s". With a comma as the decimal separator,beginis invalid and every frame shows at once. - The percent sign. The SVG goes into a data URI, and a
%in it starts an escape. Replace it at the end of the measure, withSUBSTITUTE ( _svg, "%", "%25" ), along with#as%23. - Text from the data. If a label comes from a column, escape
&as&, or the image breaks. - 25 frames is enough. At 50 ms each, the eye sees a count, not a slideshow. More frames make the SVG longer and add nothing. Each frame is about 300 characters: four KPIs add about 30 KB to the band.
- A screenshot catches one instant. If a capture shows a value under the final one, it was taken during the count. Record the screen to judge it.
Try it
- Atelier Nord: download the report, open each page and change the Finance period. The measures are
KPI band (SVG),KPI band projects (SVG),KPI band planning (SVG)andKPI band finance (SVG). - The same frames on a percentage that rises with an image: an image that reveals itself up to a percentage.
- The report itself: Atelier Nord, a free Power BI report for an architecture studio.
FAQ
Does it need a custom visual?
No. The band is a native card showing an SVG measure.
Does it work in the Power BI Service?
Yes. We published the report and checked it in the browser: the KPIs count up as in Desktop. Power BI draws the SVG the same way in both, and the <set> elements play when the image appears.
Can I count down, or count from the previous value?
Down, yes: swap the start and the end. From the previous value, no: the measure doesn't know what the card showed before. Every count starts from zero, or from any fixed value you choose.
Does the count slow down the report?
No. The 25 values are simple multiplications of a measure the card computes anyway. The cost is the text of the SVG, a few dozen kilobytes.
Can I use the default card's own number instead?
The native cards have no setting to animate their value. To animate it, the number has to be part of an image, and then every frame has to be written.
Part of a series
Atelier Nord · article 3 of 4
- Atelier Nord: a free Power BI report for an architecture studio
- A Power BI Gantt chart you can click, hover and drill into, with no custom visual
- KPI numbers that count up in Power BI, with one DAX measure
- A building that rises to its progress: an image reveal in Power BI
Related articles
 Design techniques8 November 2026
A building that rises to its progress: an image reveal in Power BI
 Design techniques8 November 2026
A Power BI Gantt chart you can click, hover and drill into, with no custom visual
 Design techniques24 October 2026