

Topic
Animated Power BI visuals without custom visuals
SVG can animate itself, and a measure can decide where every animation ends. These articles show motion along a path, staggered fills and drawing effects, all in native cards and all working in the Power BI Service, with the timings we chose and why.
3 articles
 Design techniques24 October 20269 min read
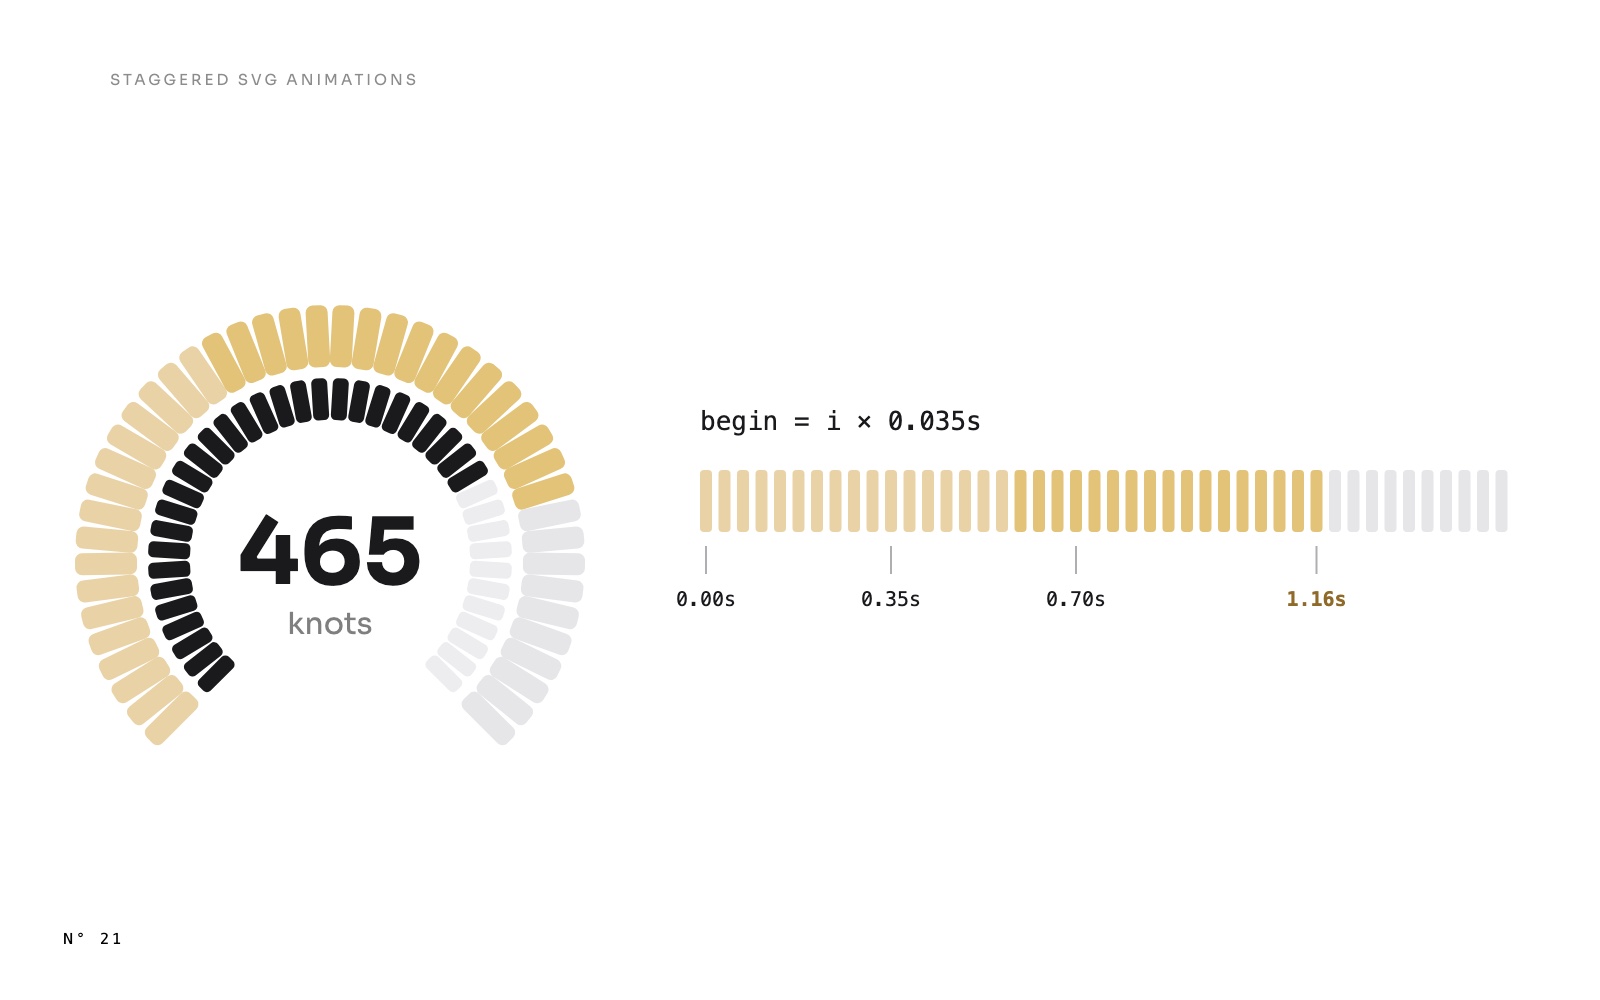
A gauge that fills segment by segment: staggered SVG animations in Power BI
Gauges that fill segment by segment, bars that rise one after another, lists that appear row by row: one DAX pattern gives each SVG element its own start time.AnimationSVG and DAX visuals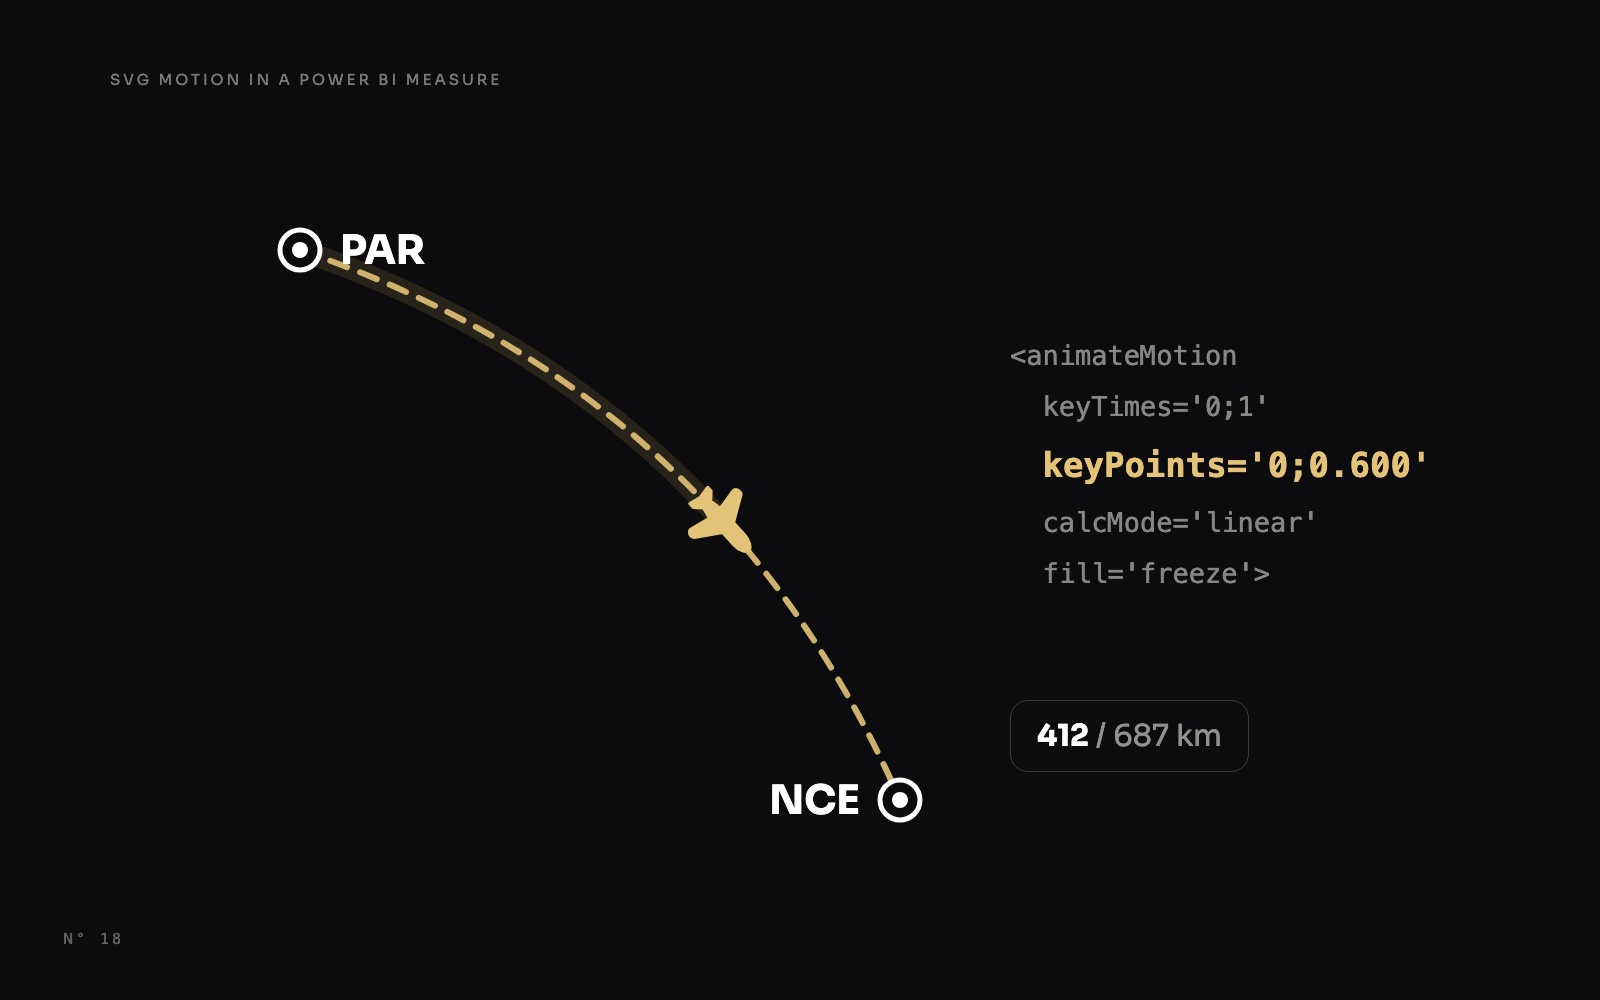 Design techniques24 October 20269 min read
The jet that stops where the flight is: SVG motion in a Power BI measure
Make a jet fly along its route and stop at the share of the flight already flown, with SVG animateMotion written by a DAX measure, in a native card.AnimationSVG and DAX visualsMaps Free reports19 October 202610 min read