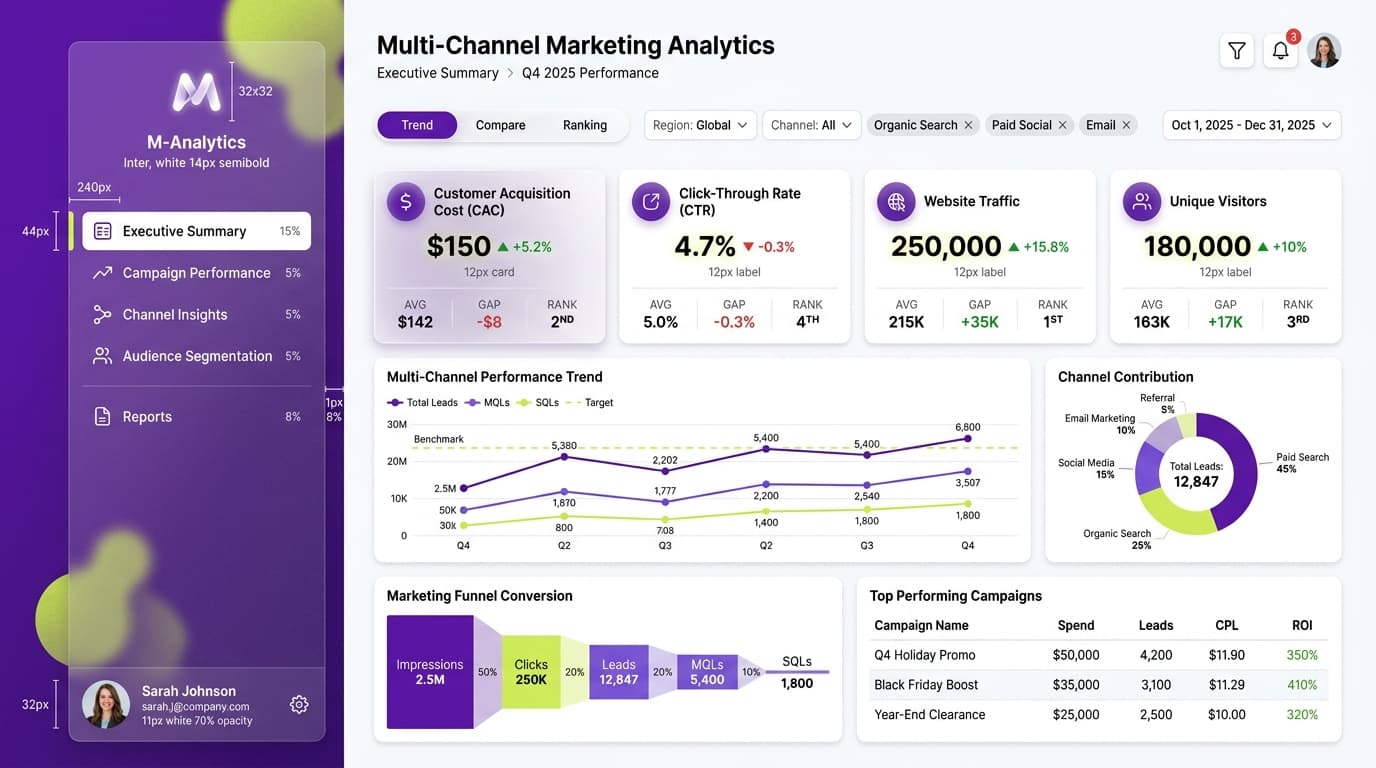
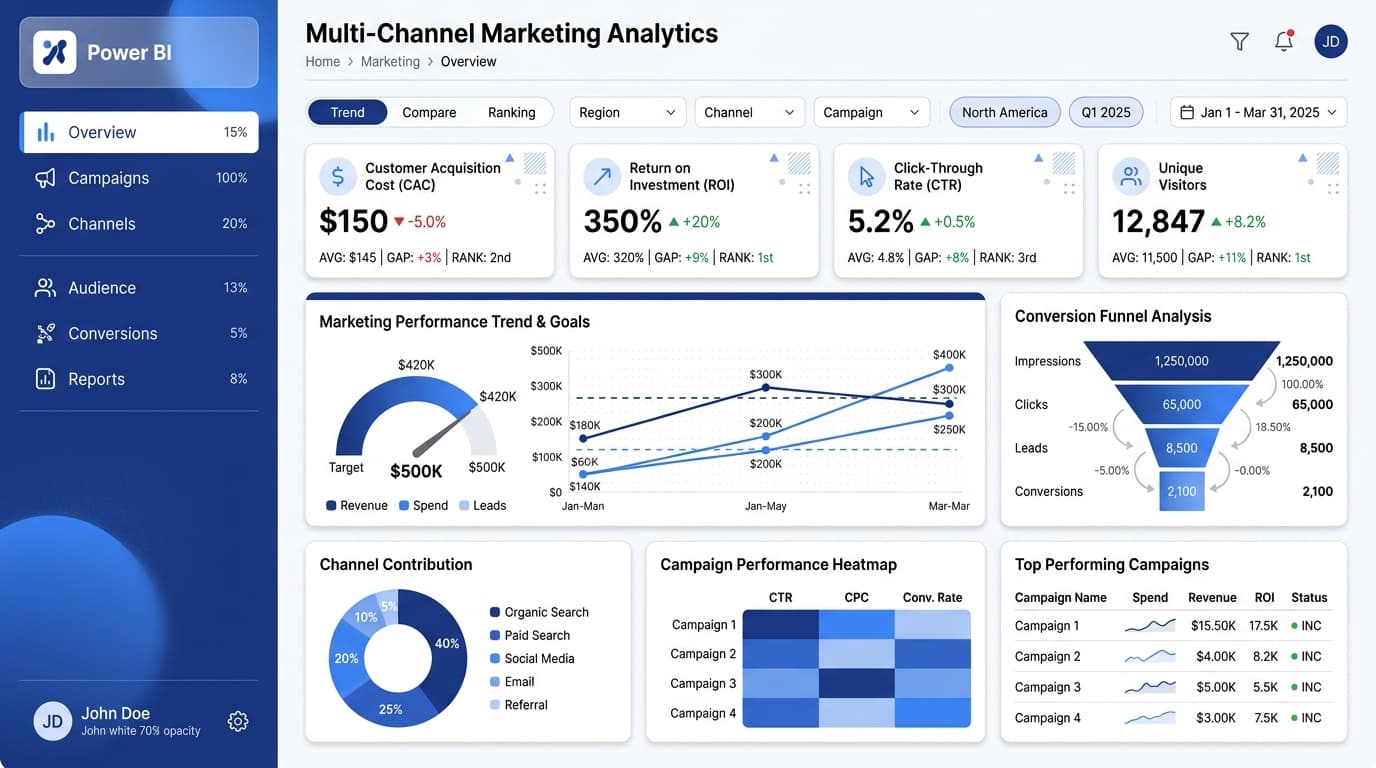
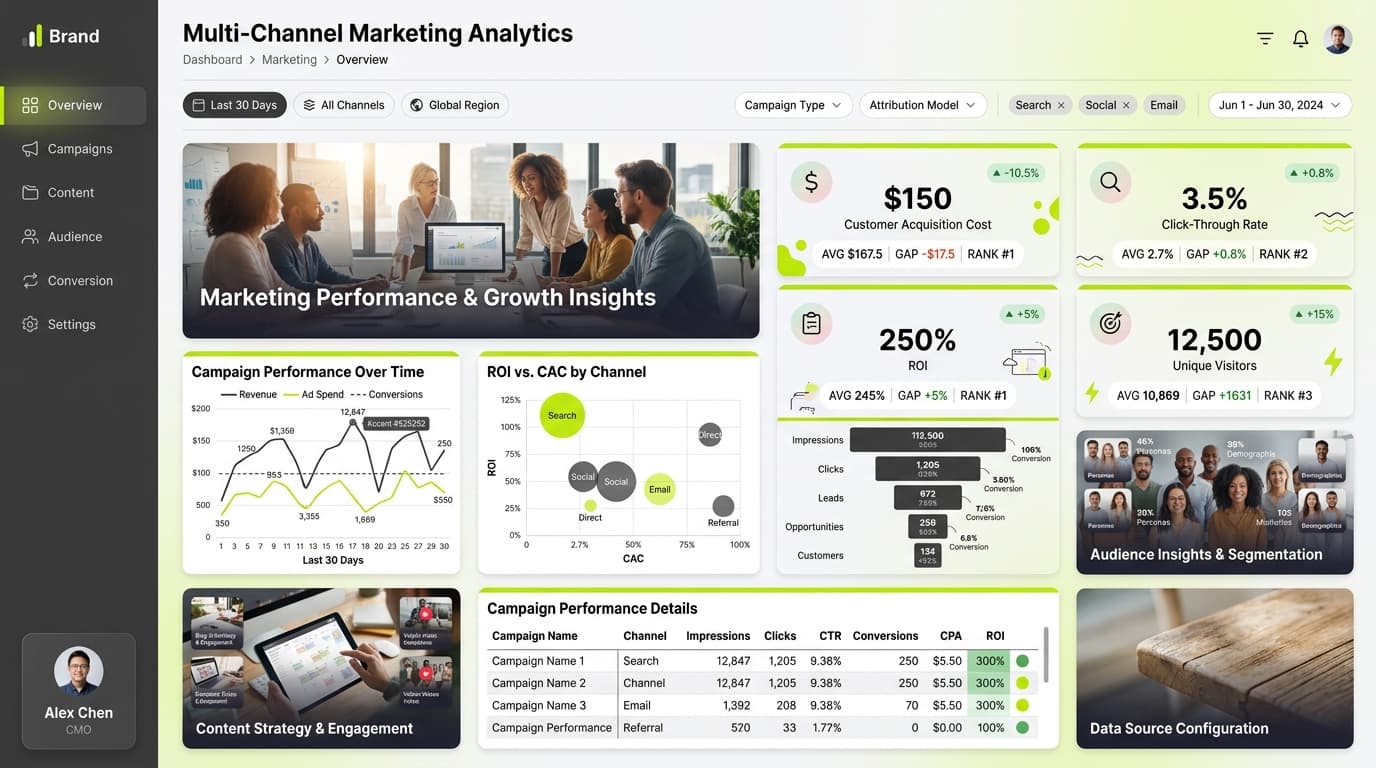
About this dashboard
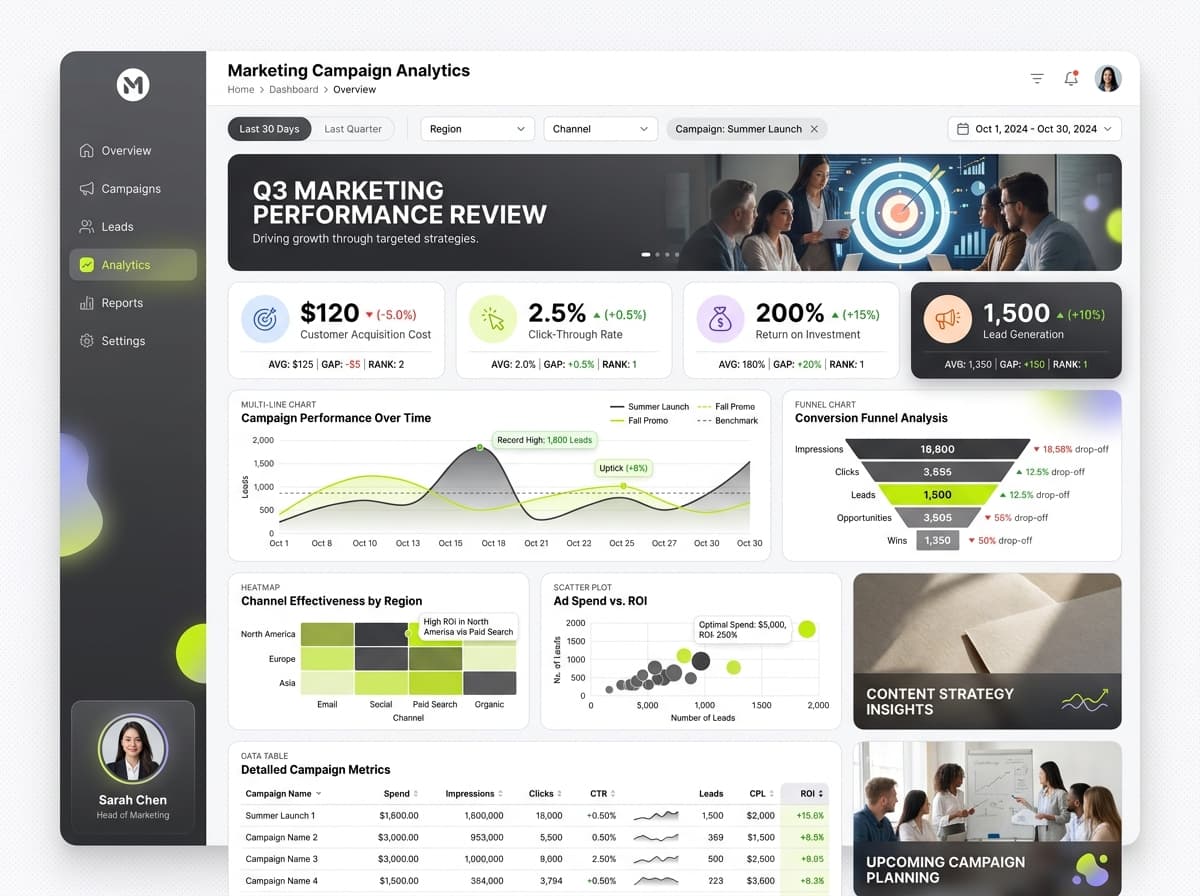
Analyze and optimize performance metrics across various marketing channels including Google Ads, Meta, and email campaigns.
KPIs tracked
Charts
Strategic insights
Design recommendations
Color Palette Strategy
HighUtilize the graphite-lime palette effectively by using graphite (#3D3D3D) for backgrounds and headers, lime (#AEEA00) for key metrics, and maintaining a 4.5:1 contrast ratio for accessibility.
Layout & Grid System
HighAdopt a 12-column grid system for the 4:3 ratio layout. Position KPIs at the top for visibility, charts in the center for analysis, and filters on the sidebar. Use 16px padding and 20px gaps between sections.
Typography Hierarchy
MediumEstablish a clear typography hierarchy: Dashboard title at 28px bold, section headers at 20px semibold, card titles at 16px medium, and body text at 14px regular for readability.
Data Visualization UX
HighChoose chart types that fit the data narrative: use the Gauge Chart for CAC, Scatter Plot to visualize CTR across channels, and Funnel Chart for lead conversion. Limit chart colors to 5 for clarity.
Visual Hierarchy & Focus
MediumCreate a clear visual hierarchy by emphasizing the most critical metrics with larger fonts and bold styles. Use whitespace effectively to separate sections and apply conditional formatting for anomalies.
Interaction & Feedback
LowImplement hover states with subtle opacity changes for interactive elements, and provide loading indicators during data refresh. Ensure intuitive navigation for drilling into detailed views.