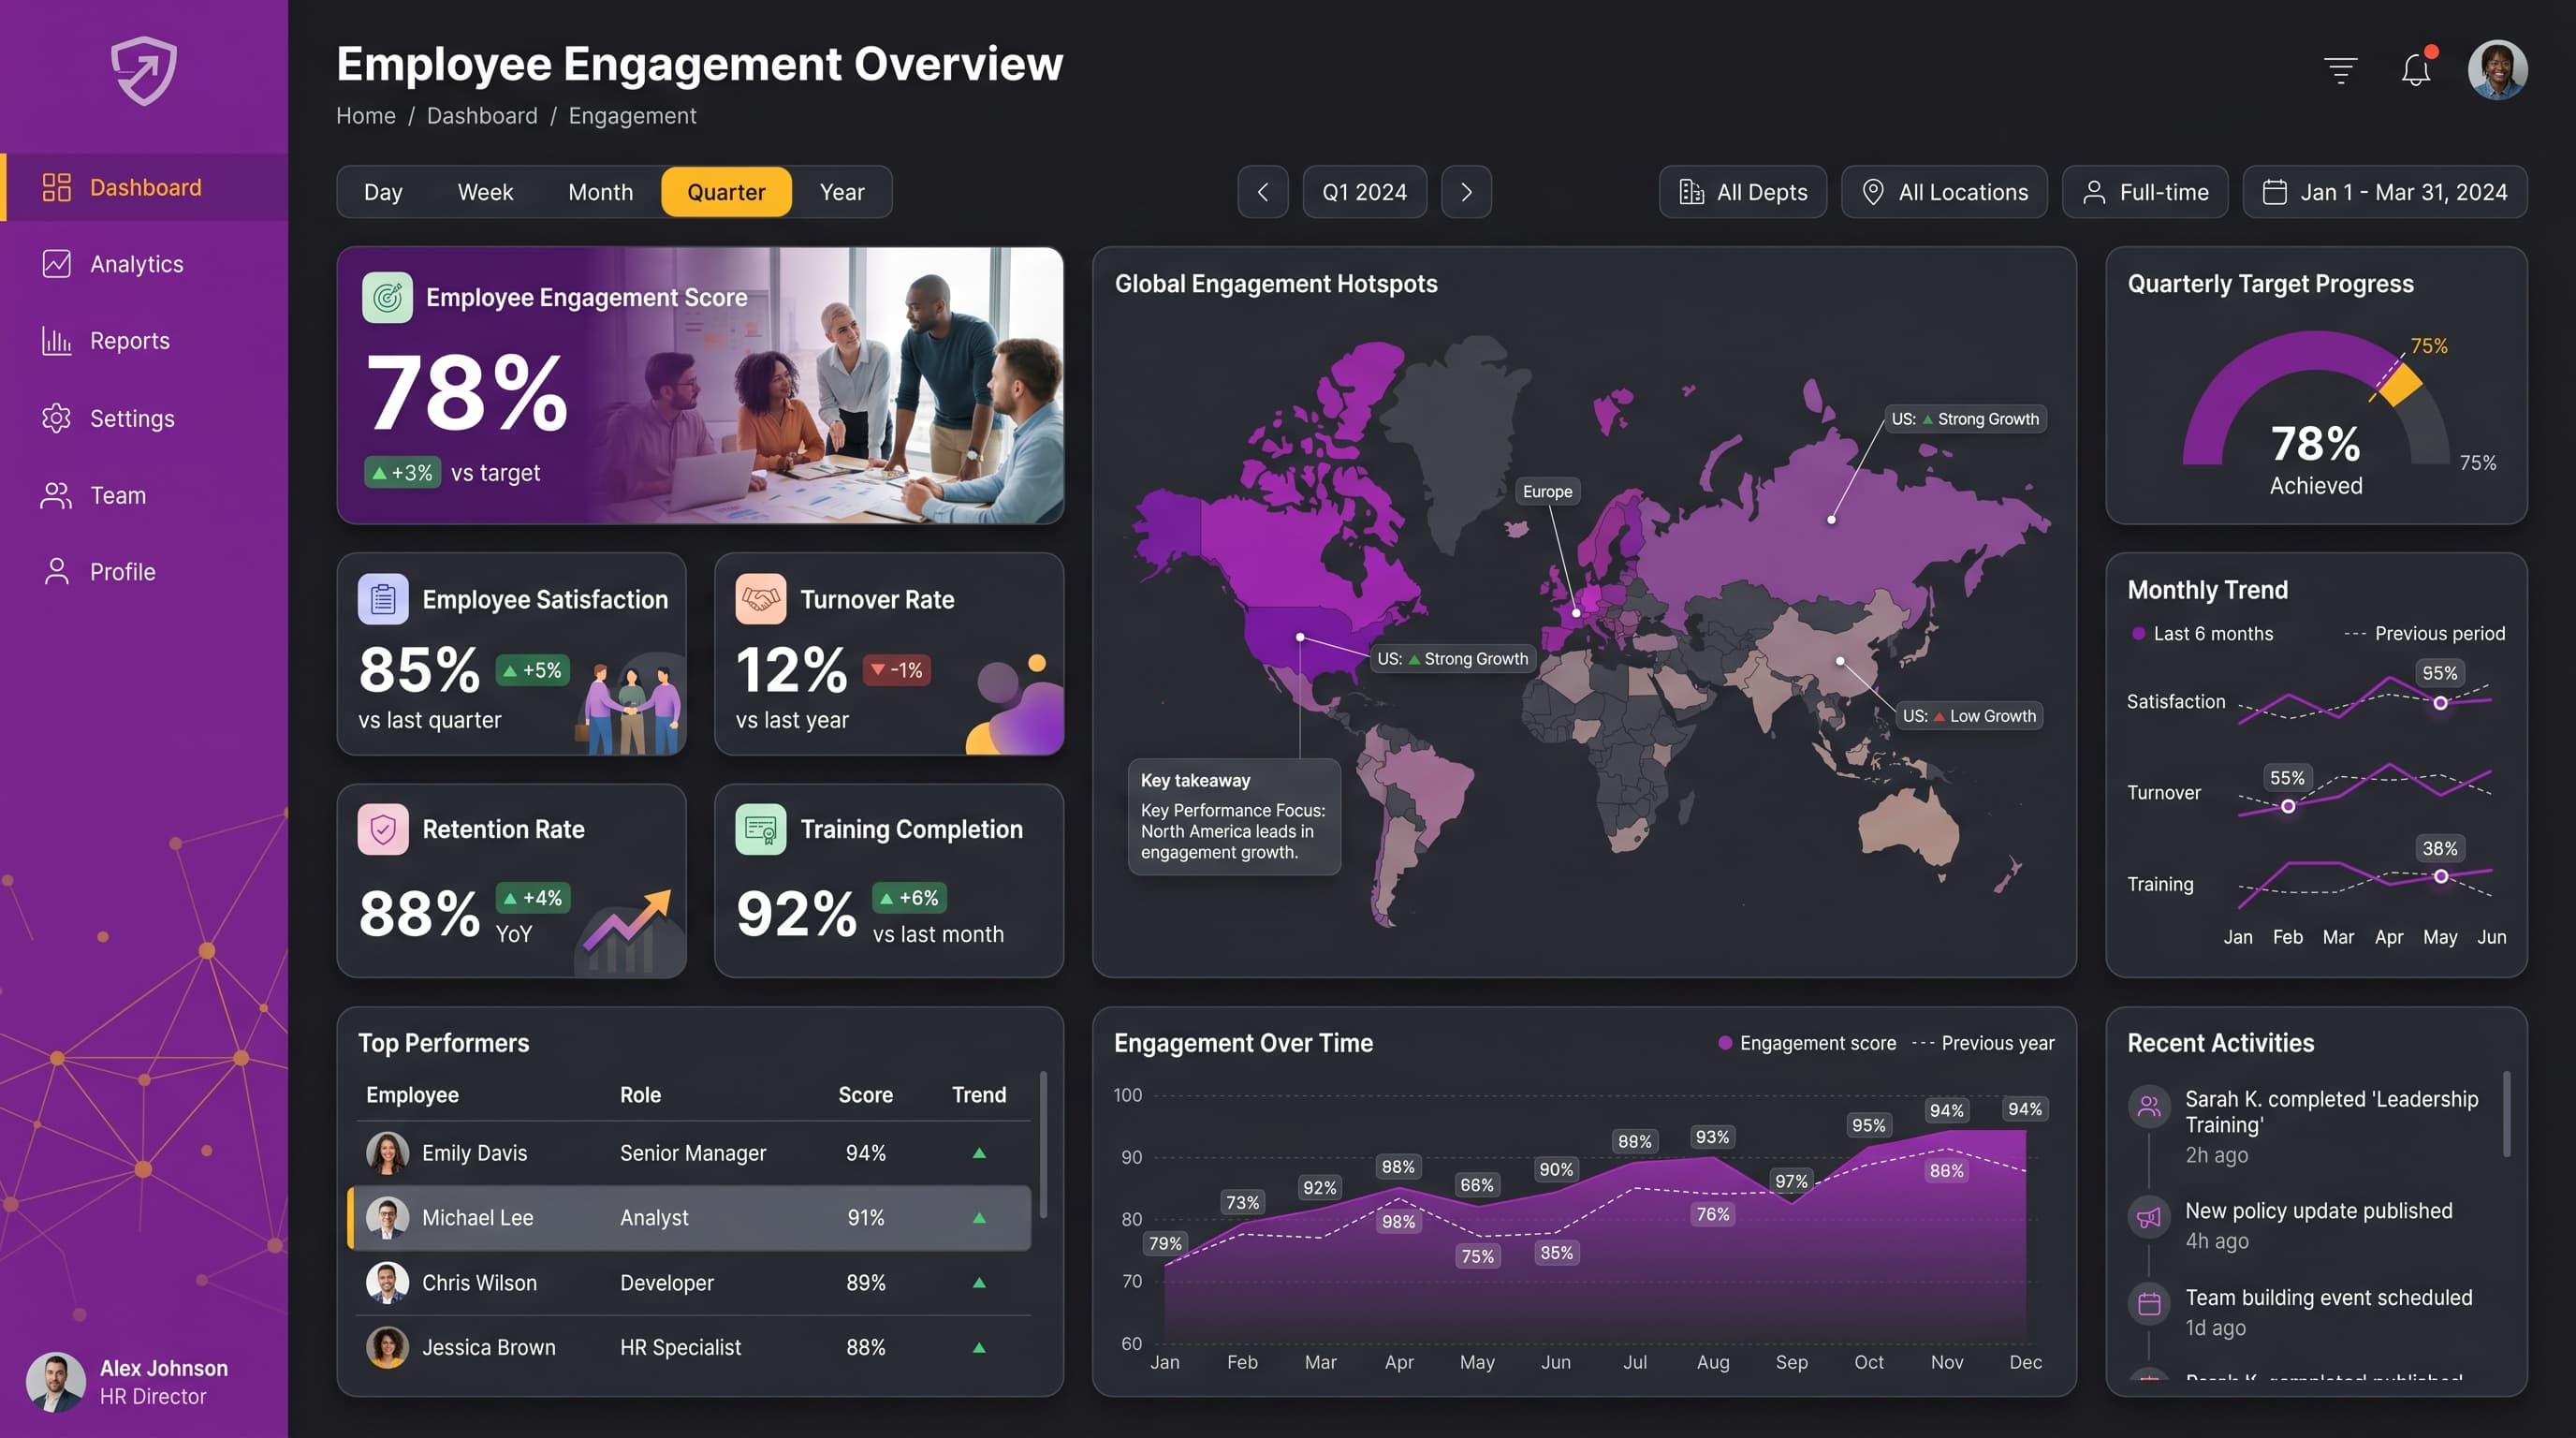
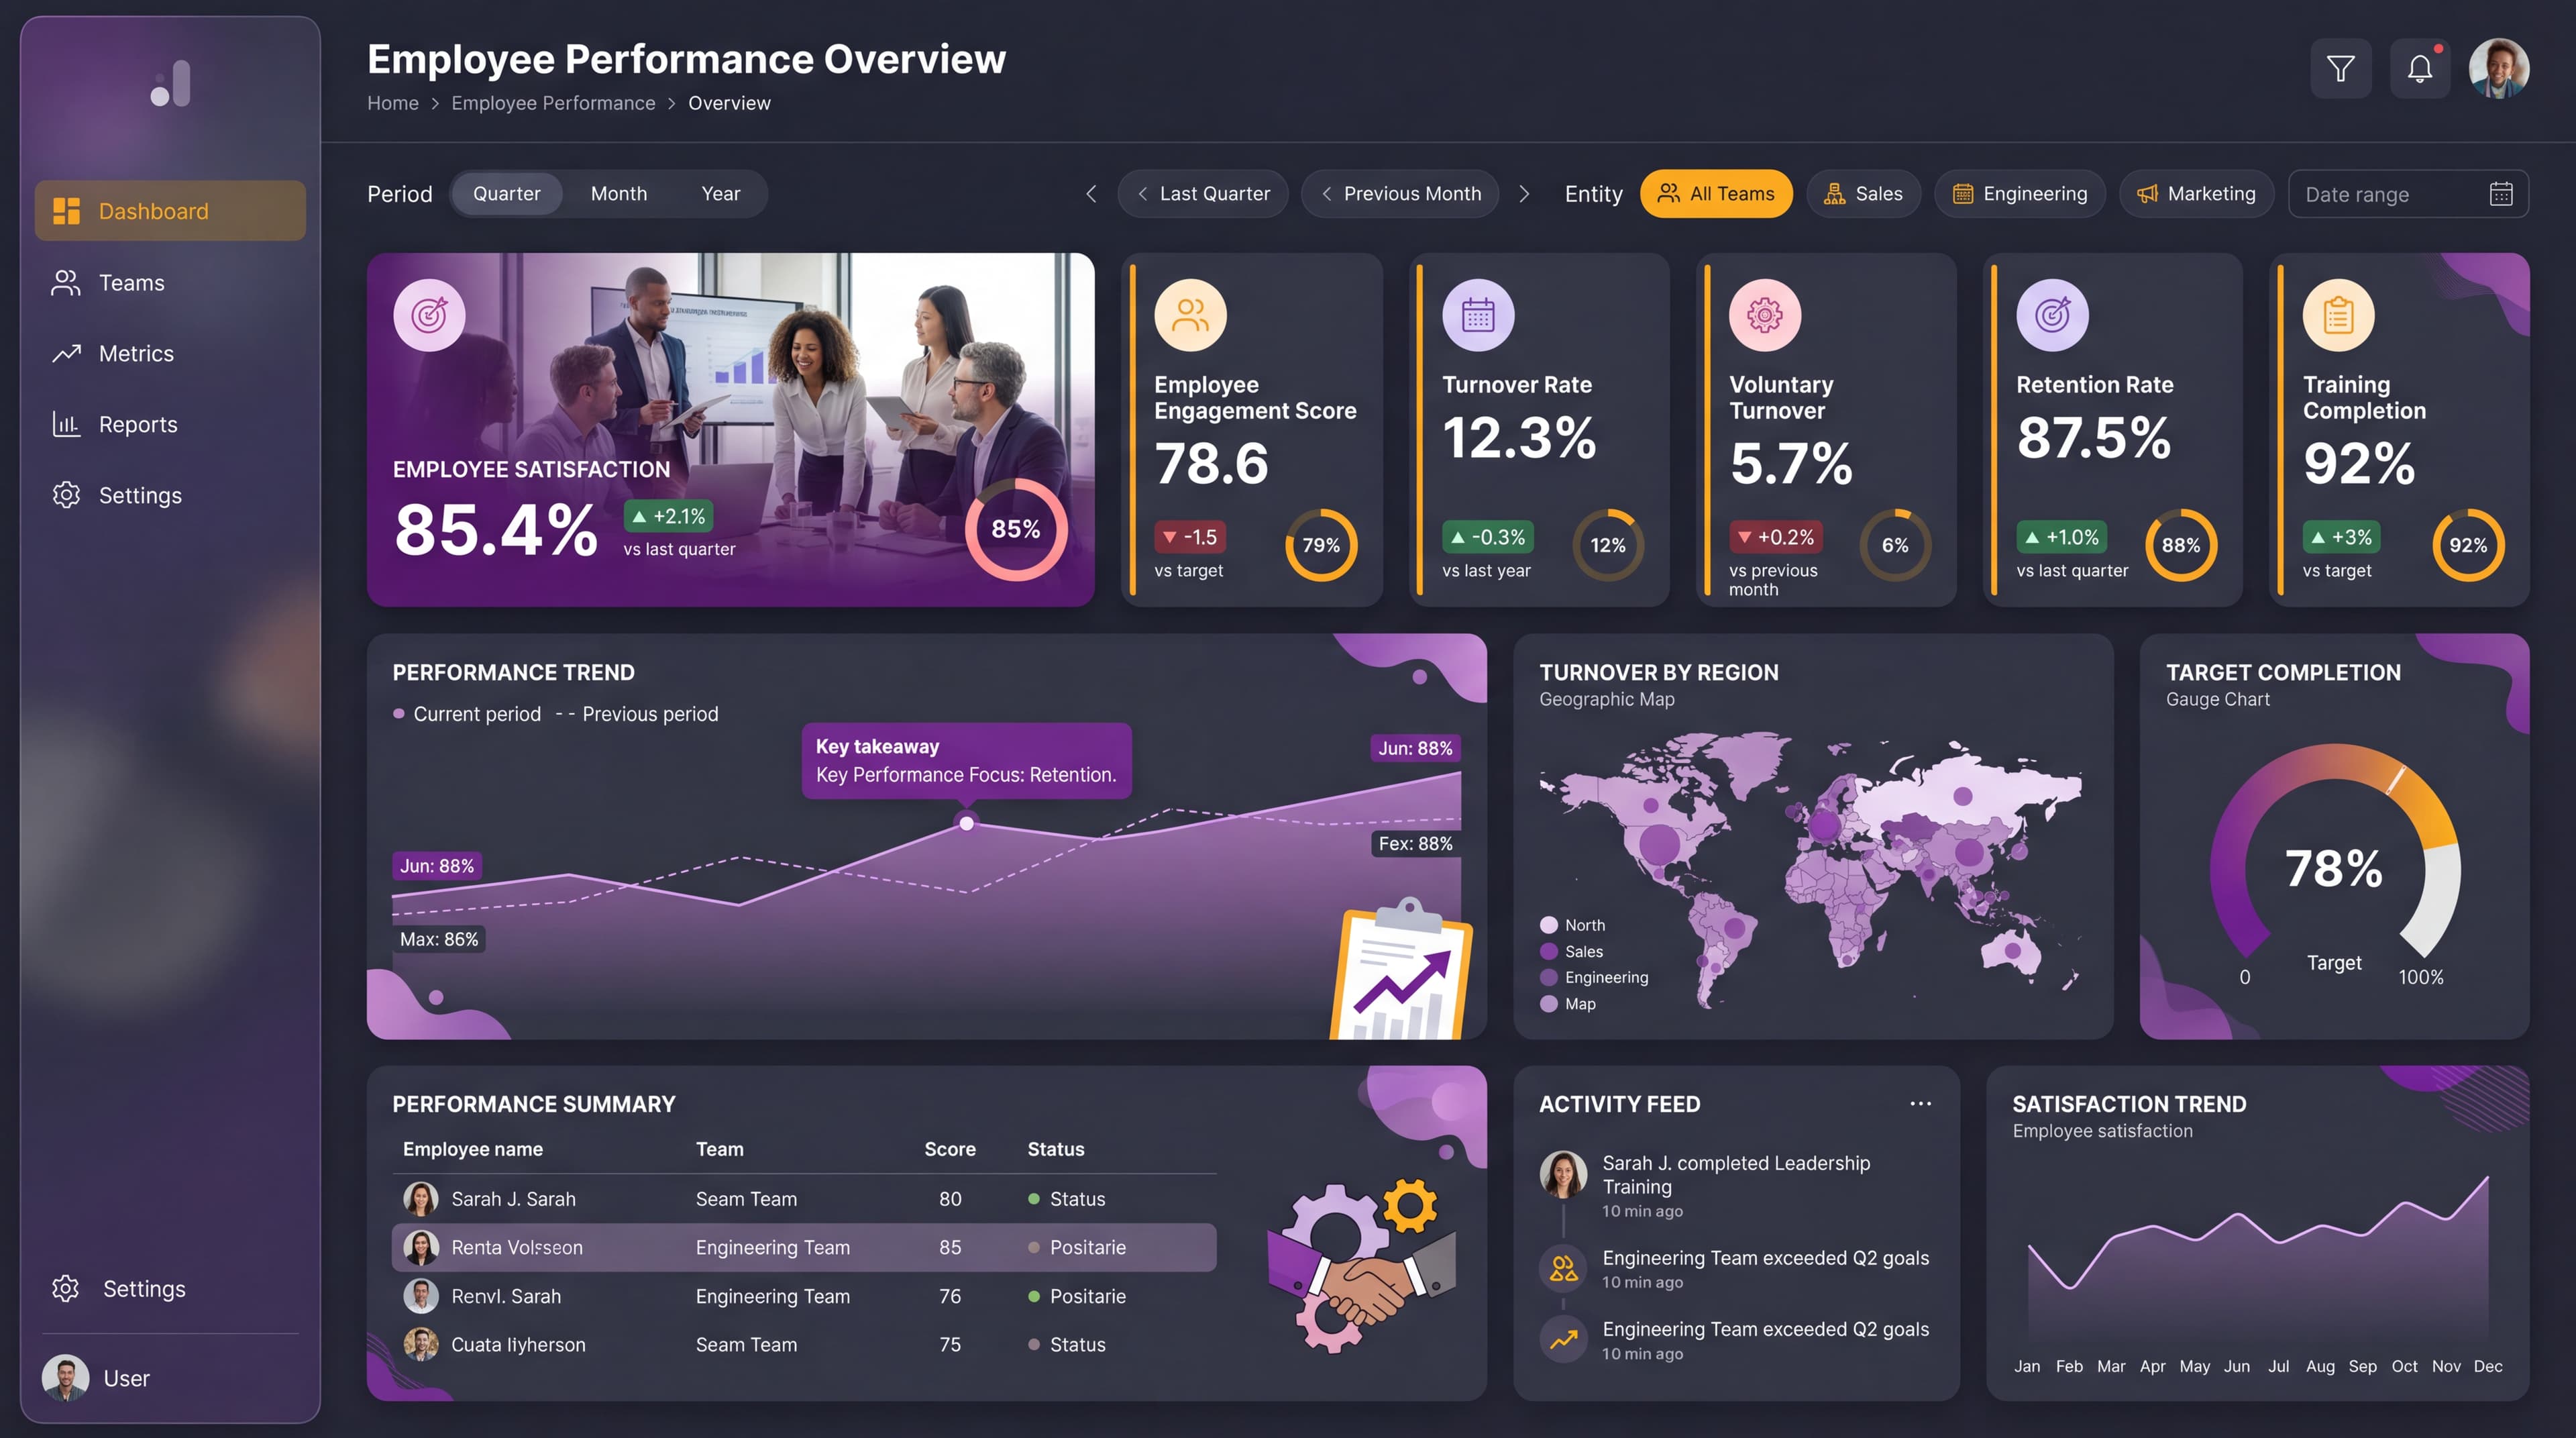
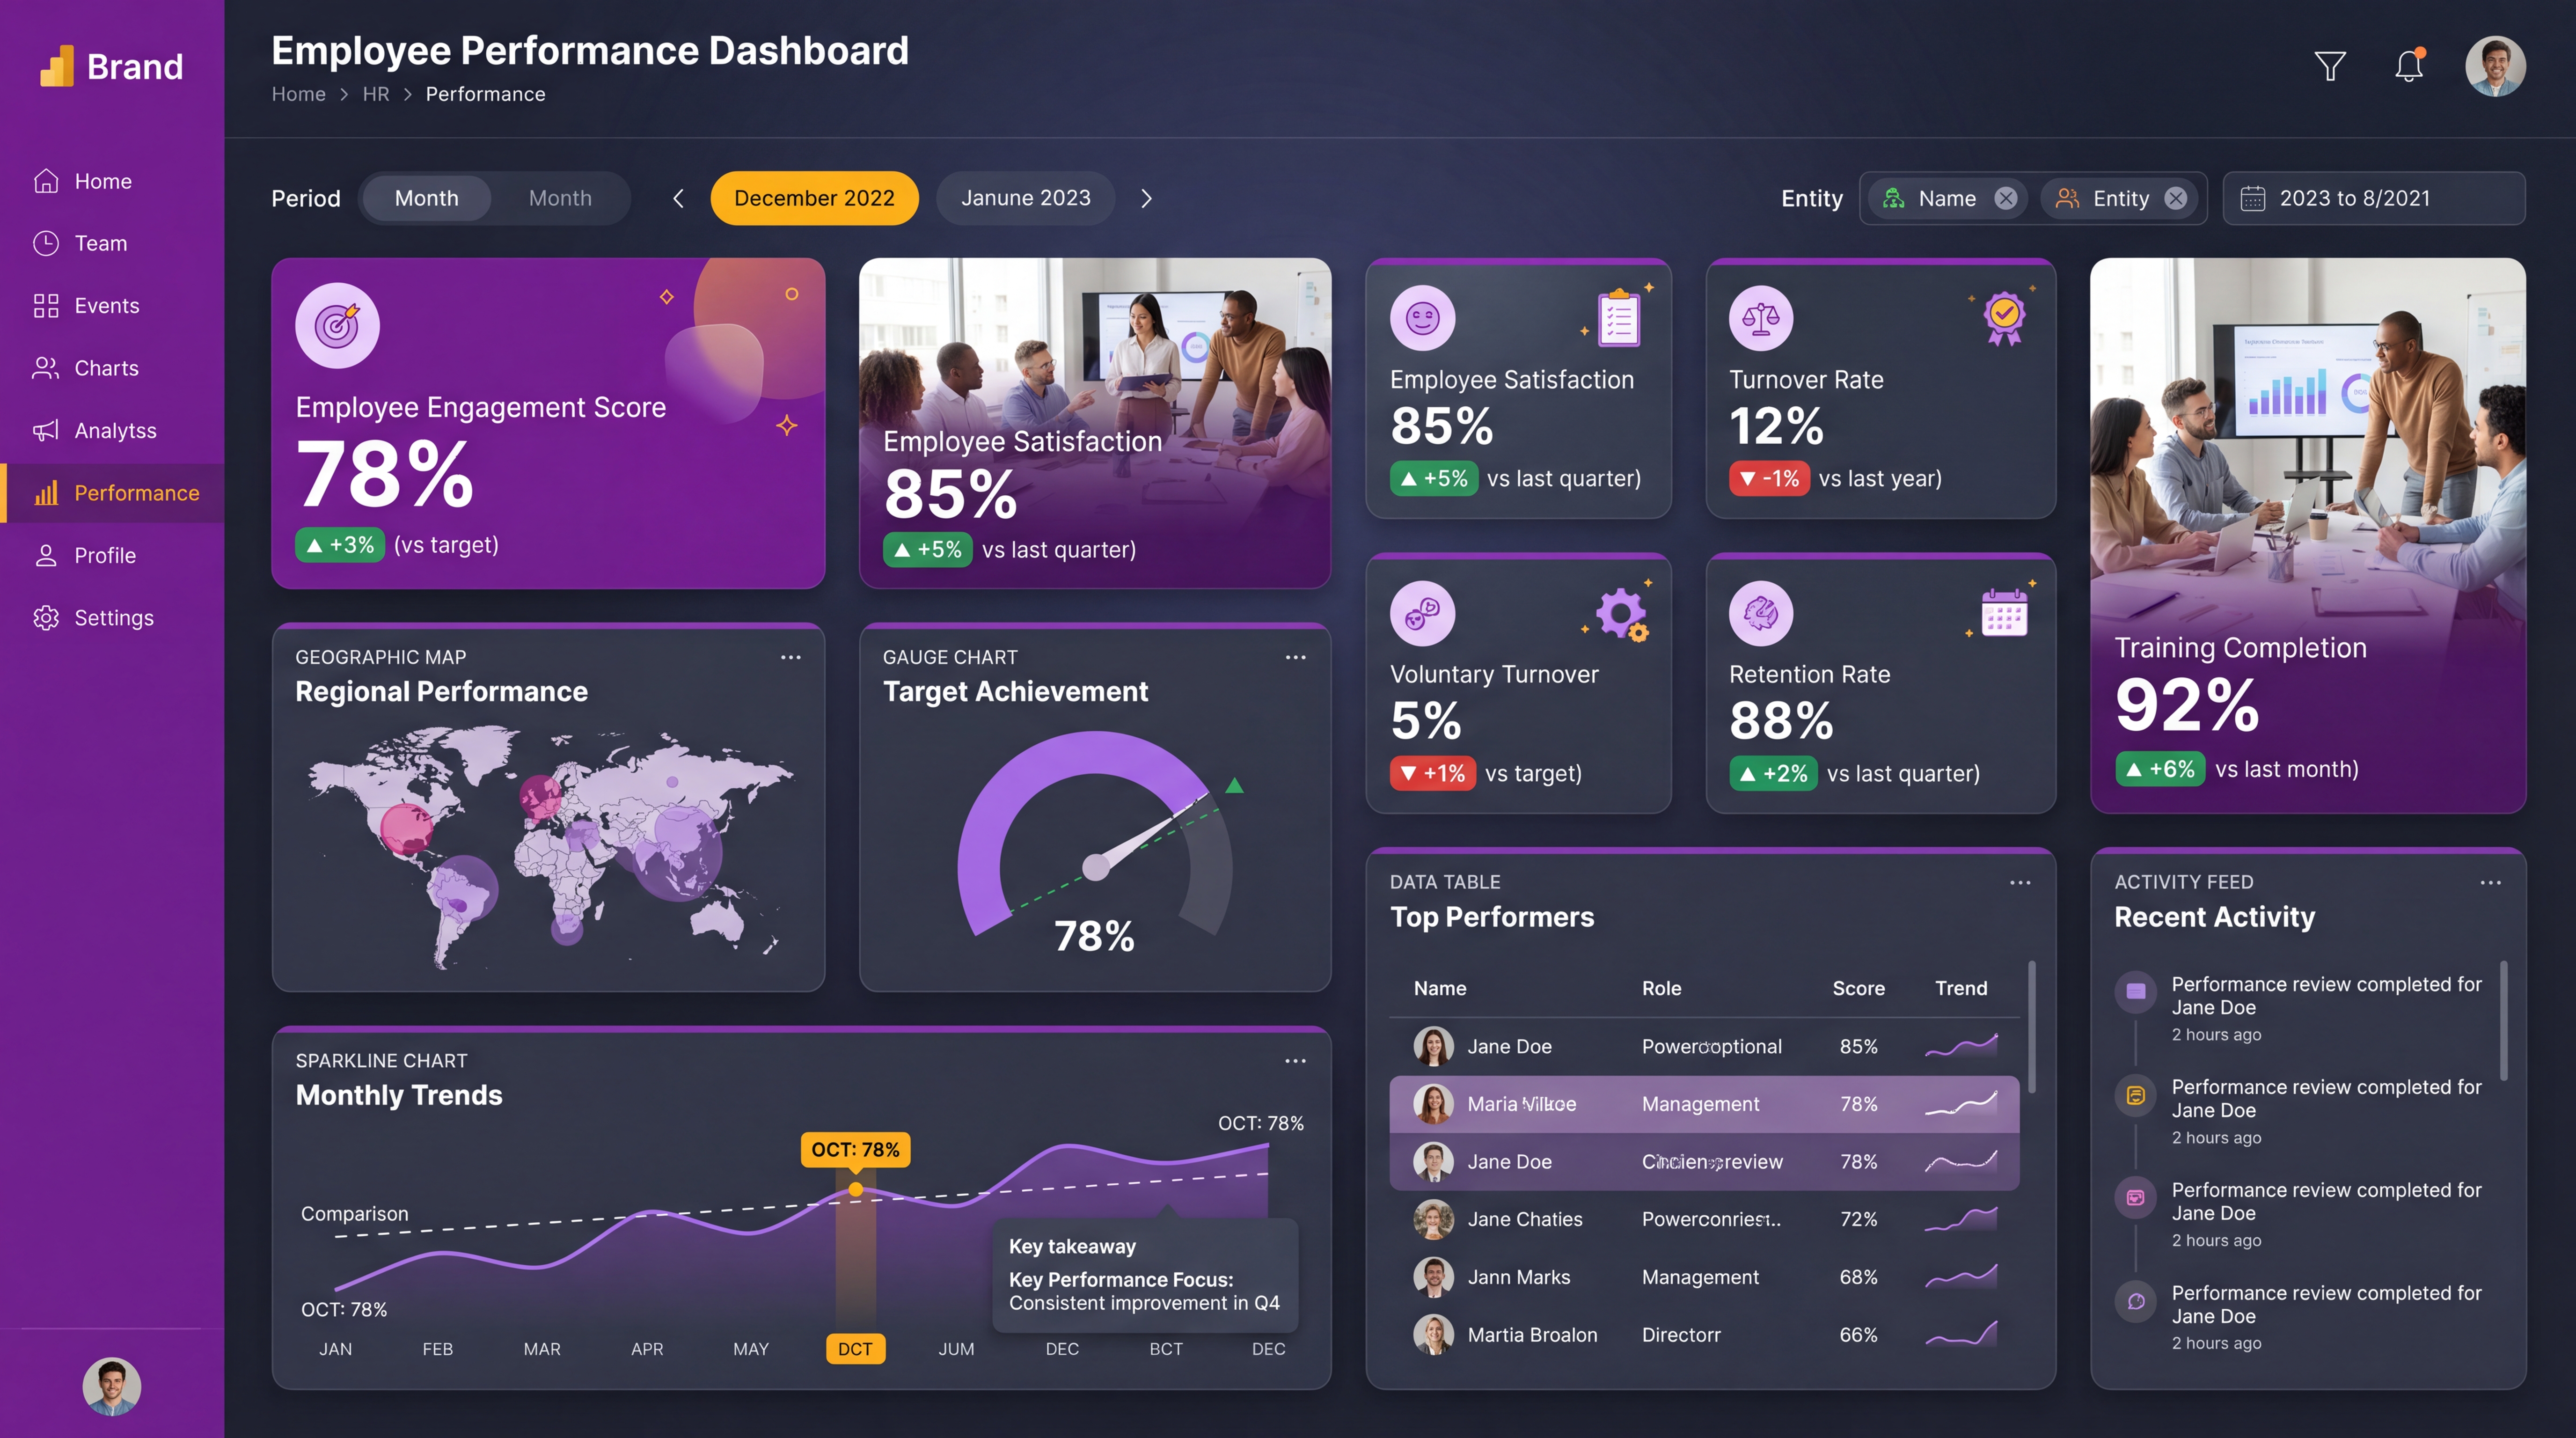
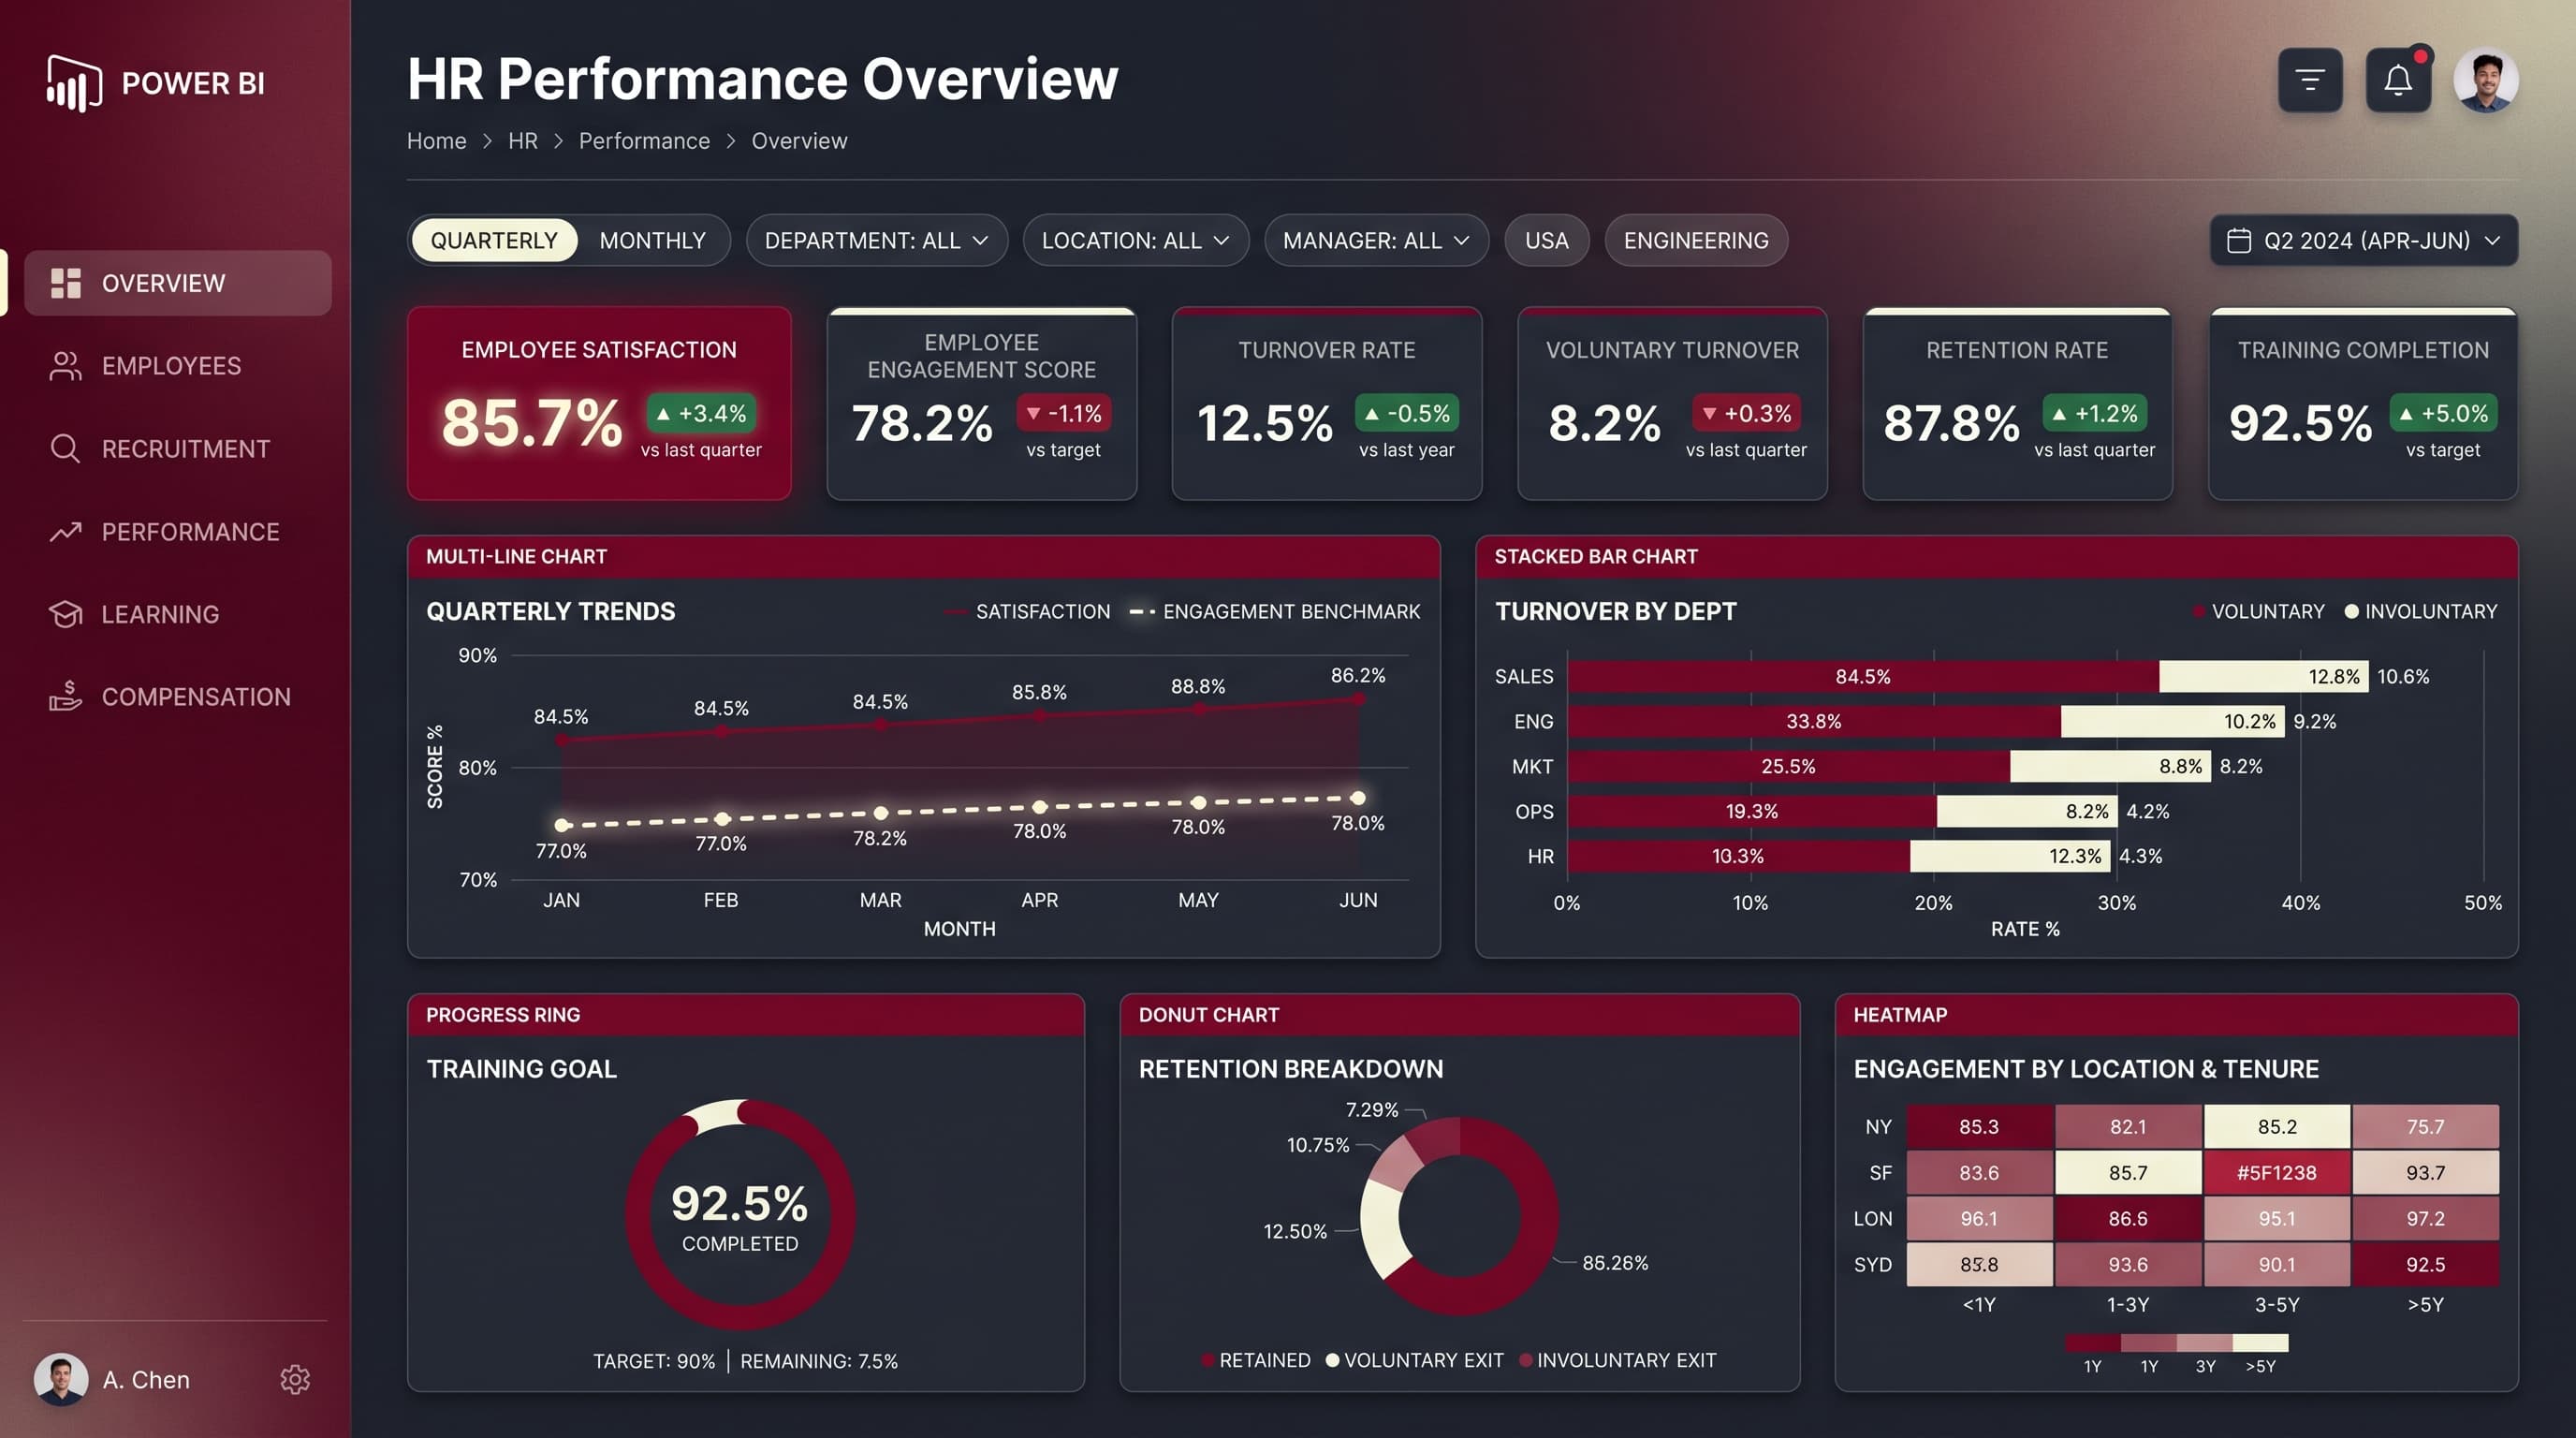
About this dashboard
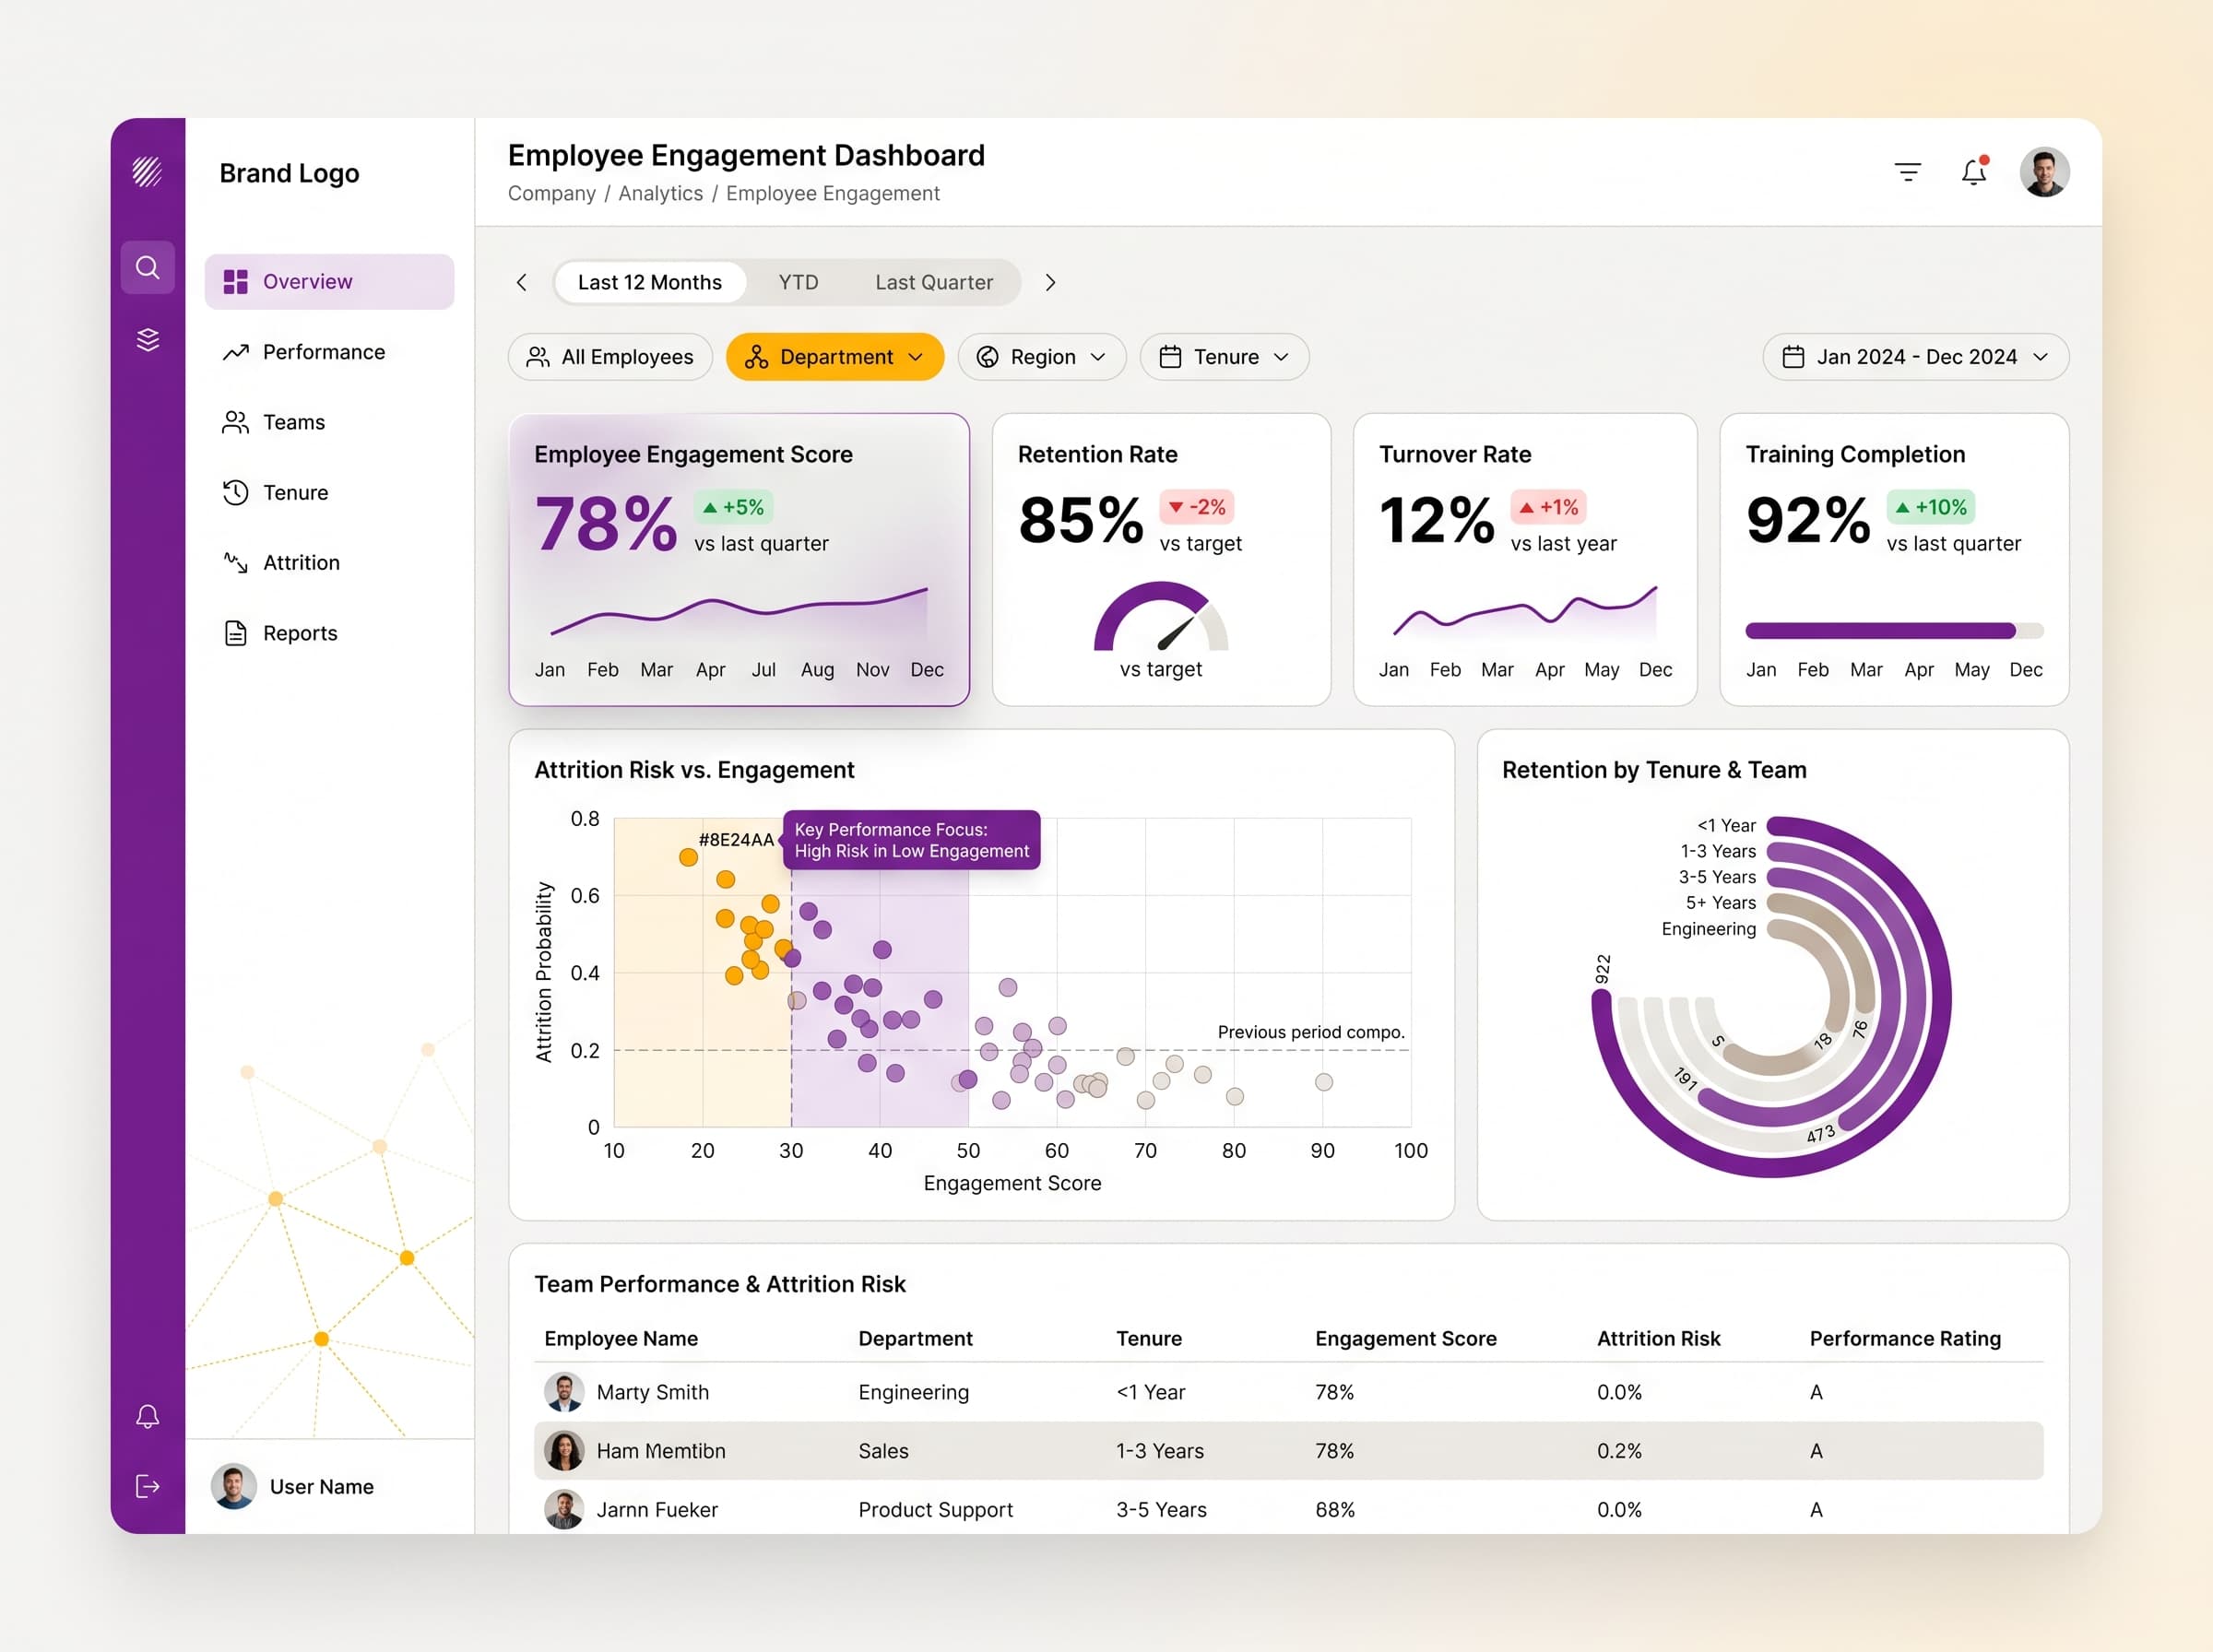
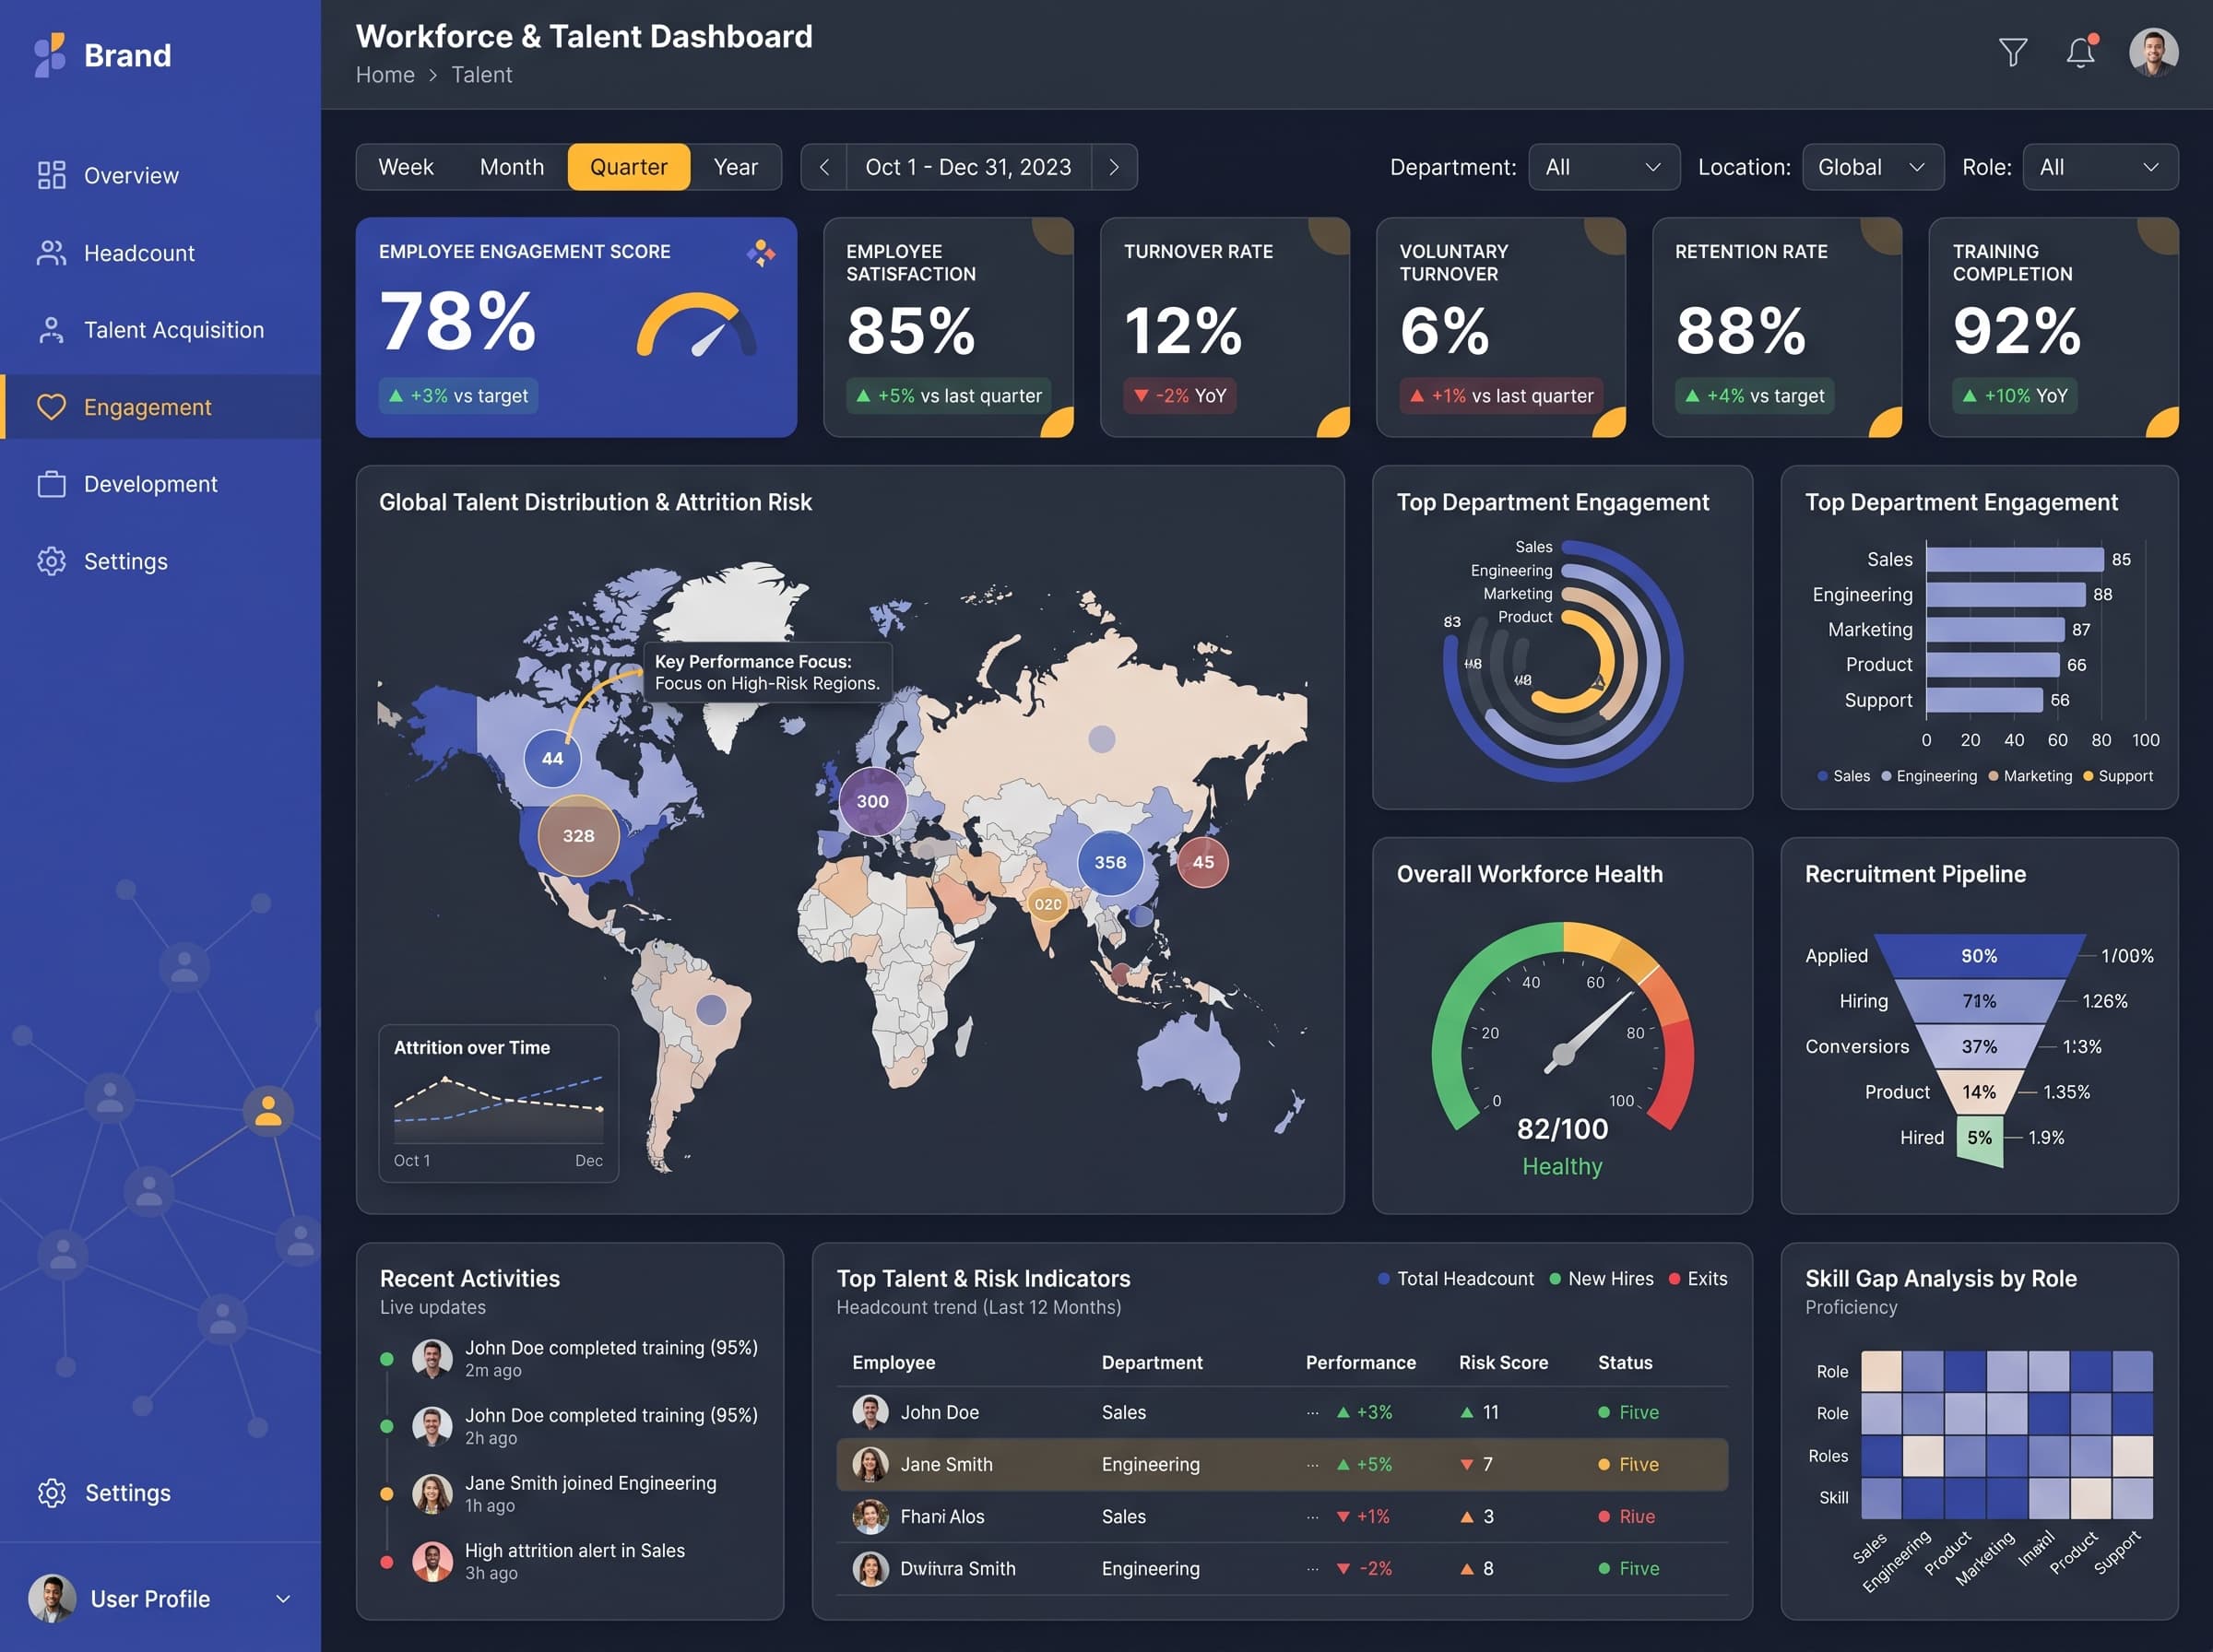
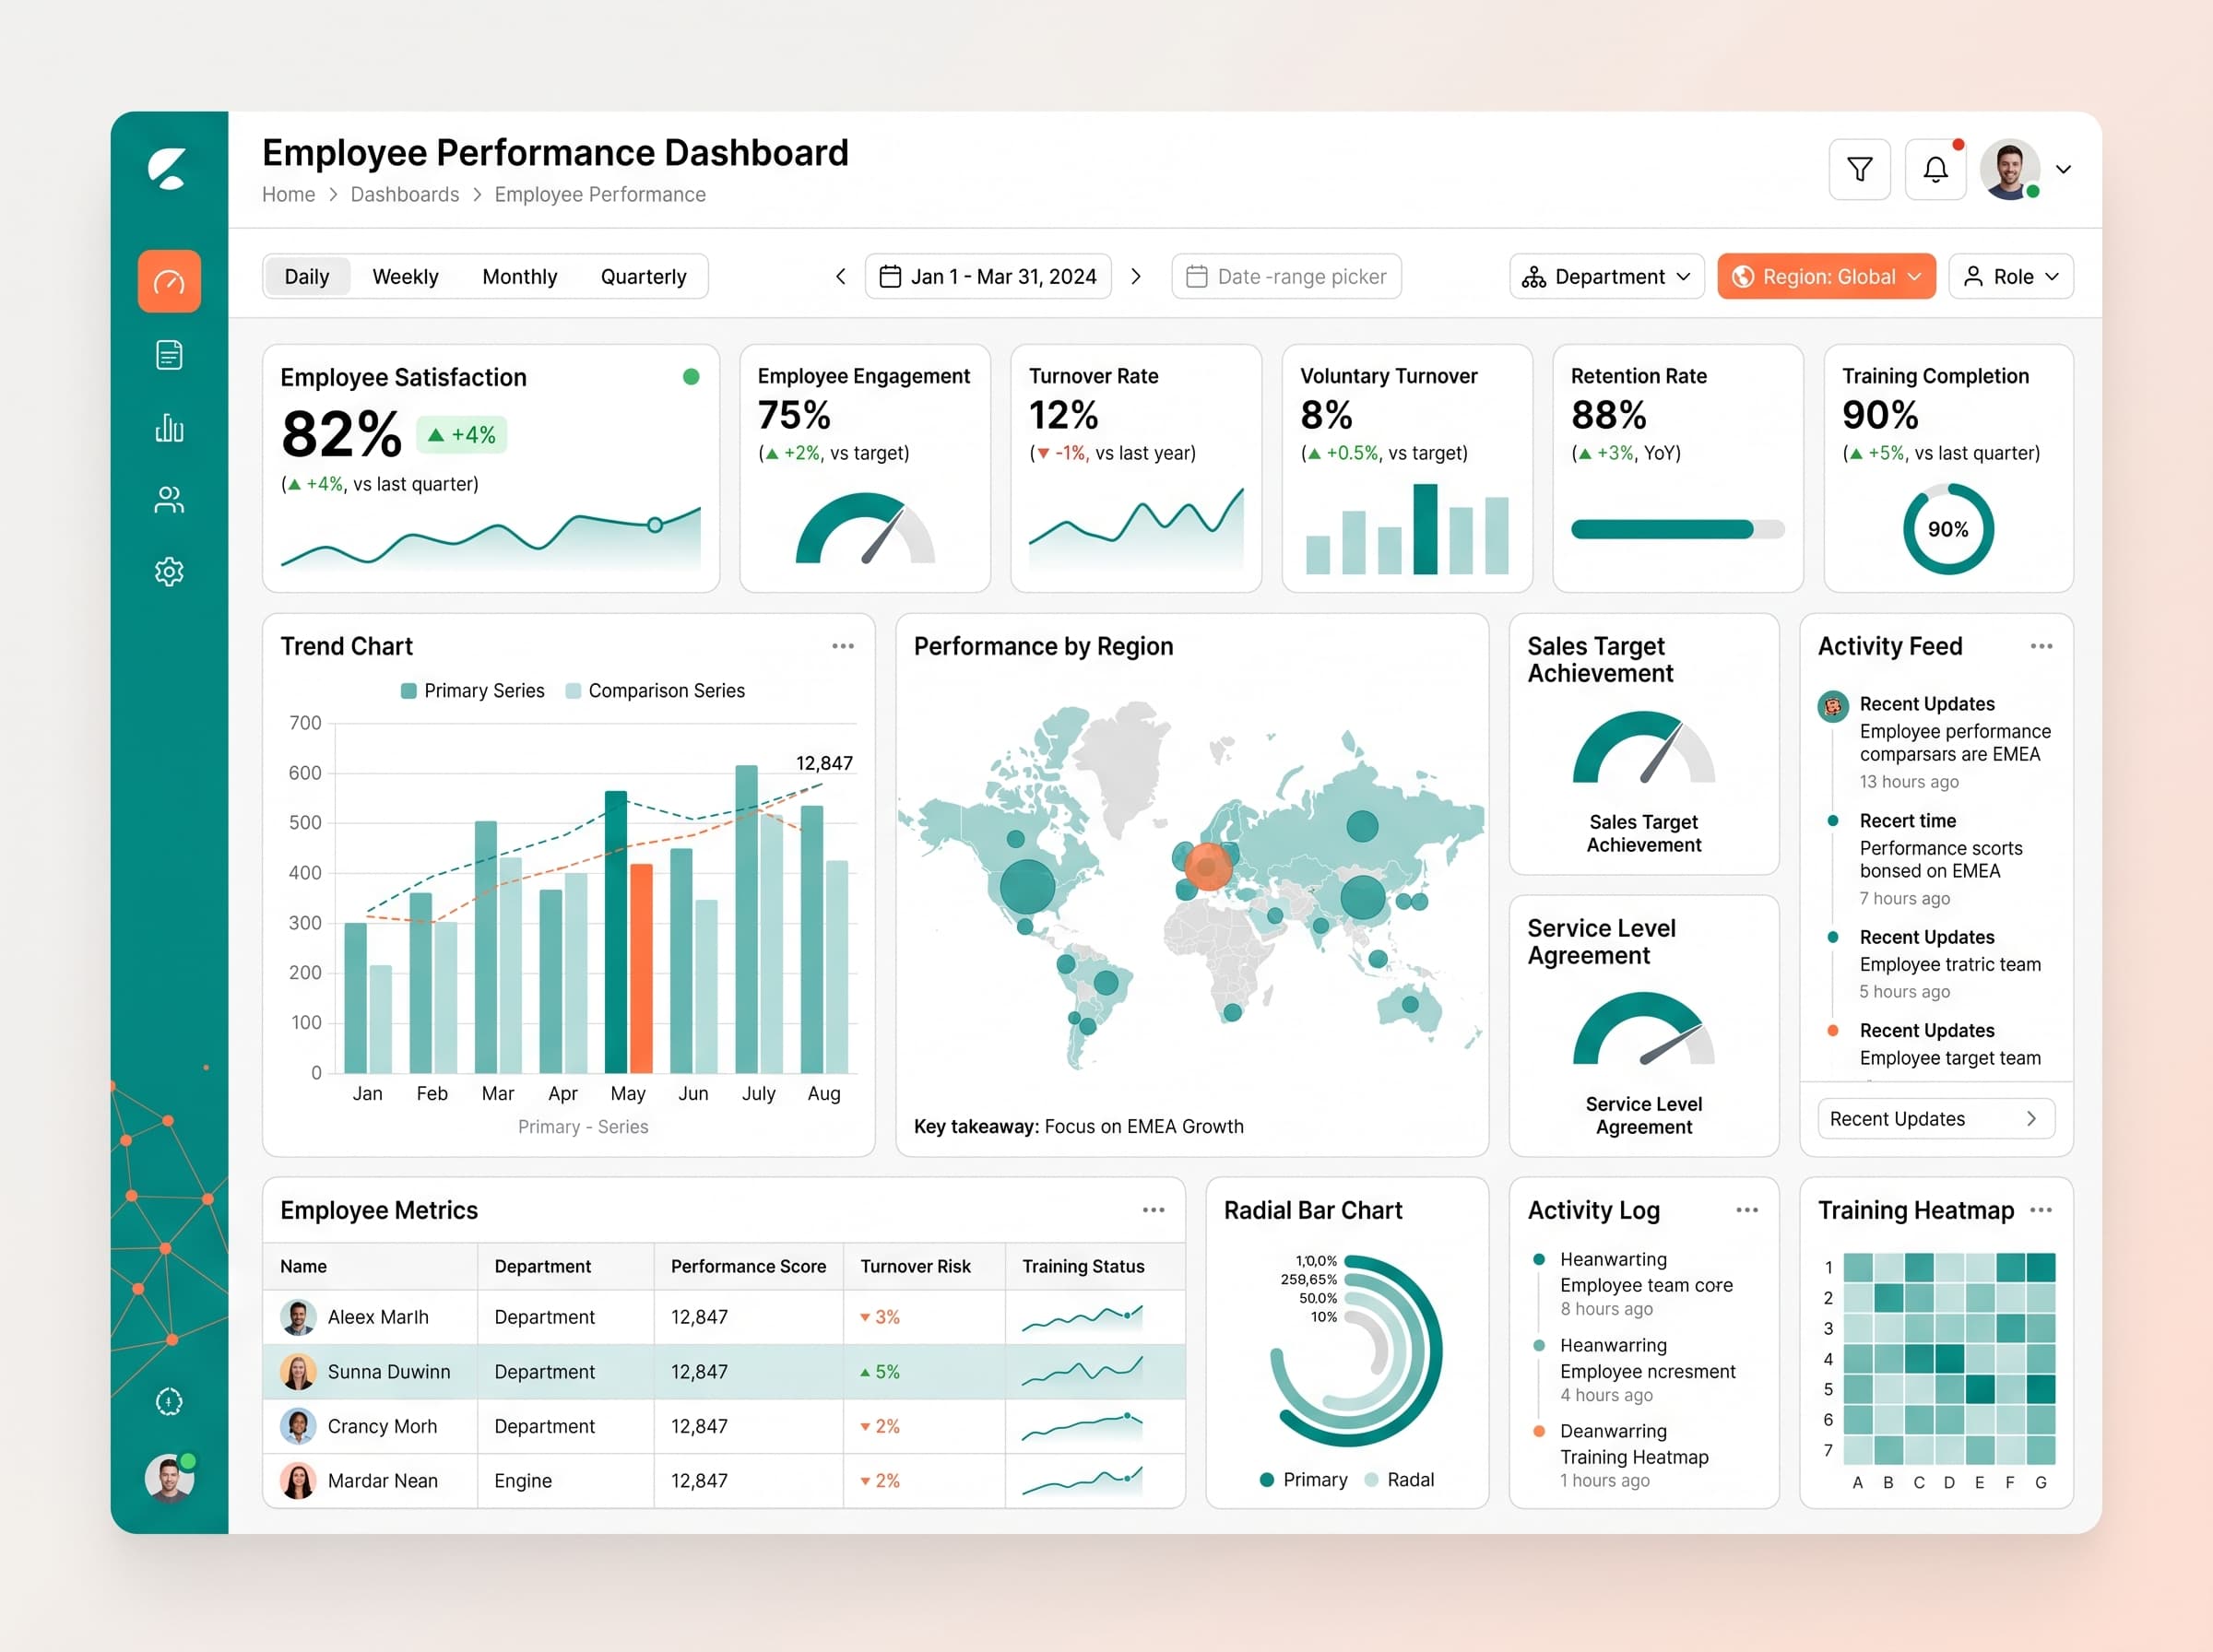
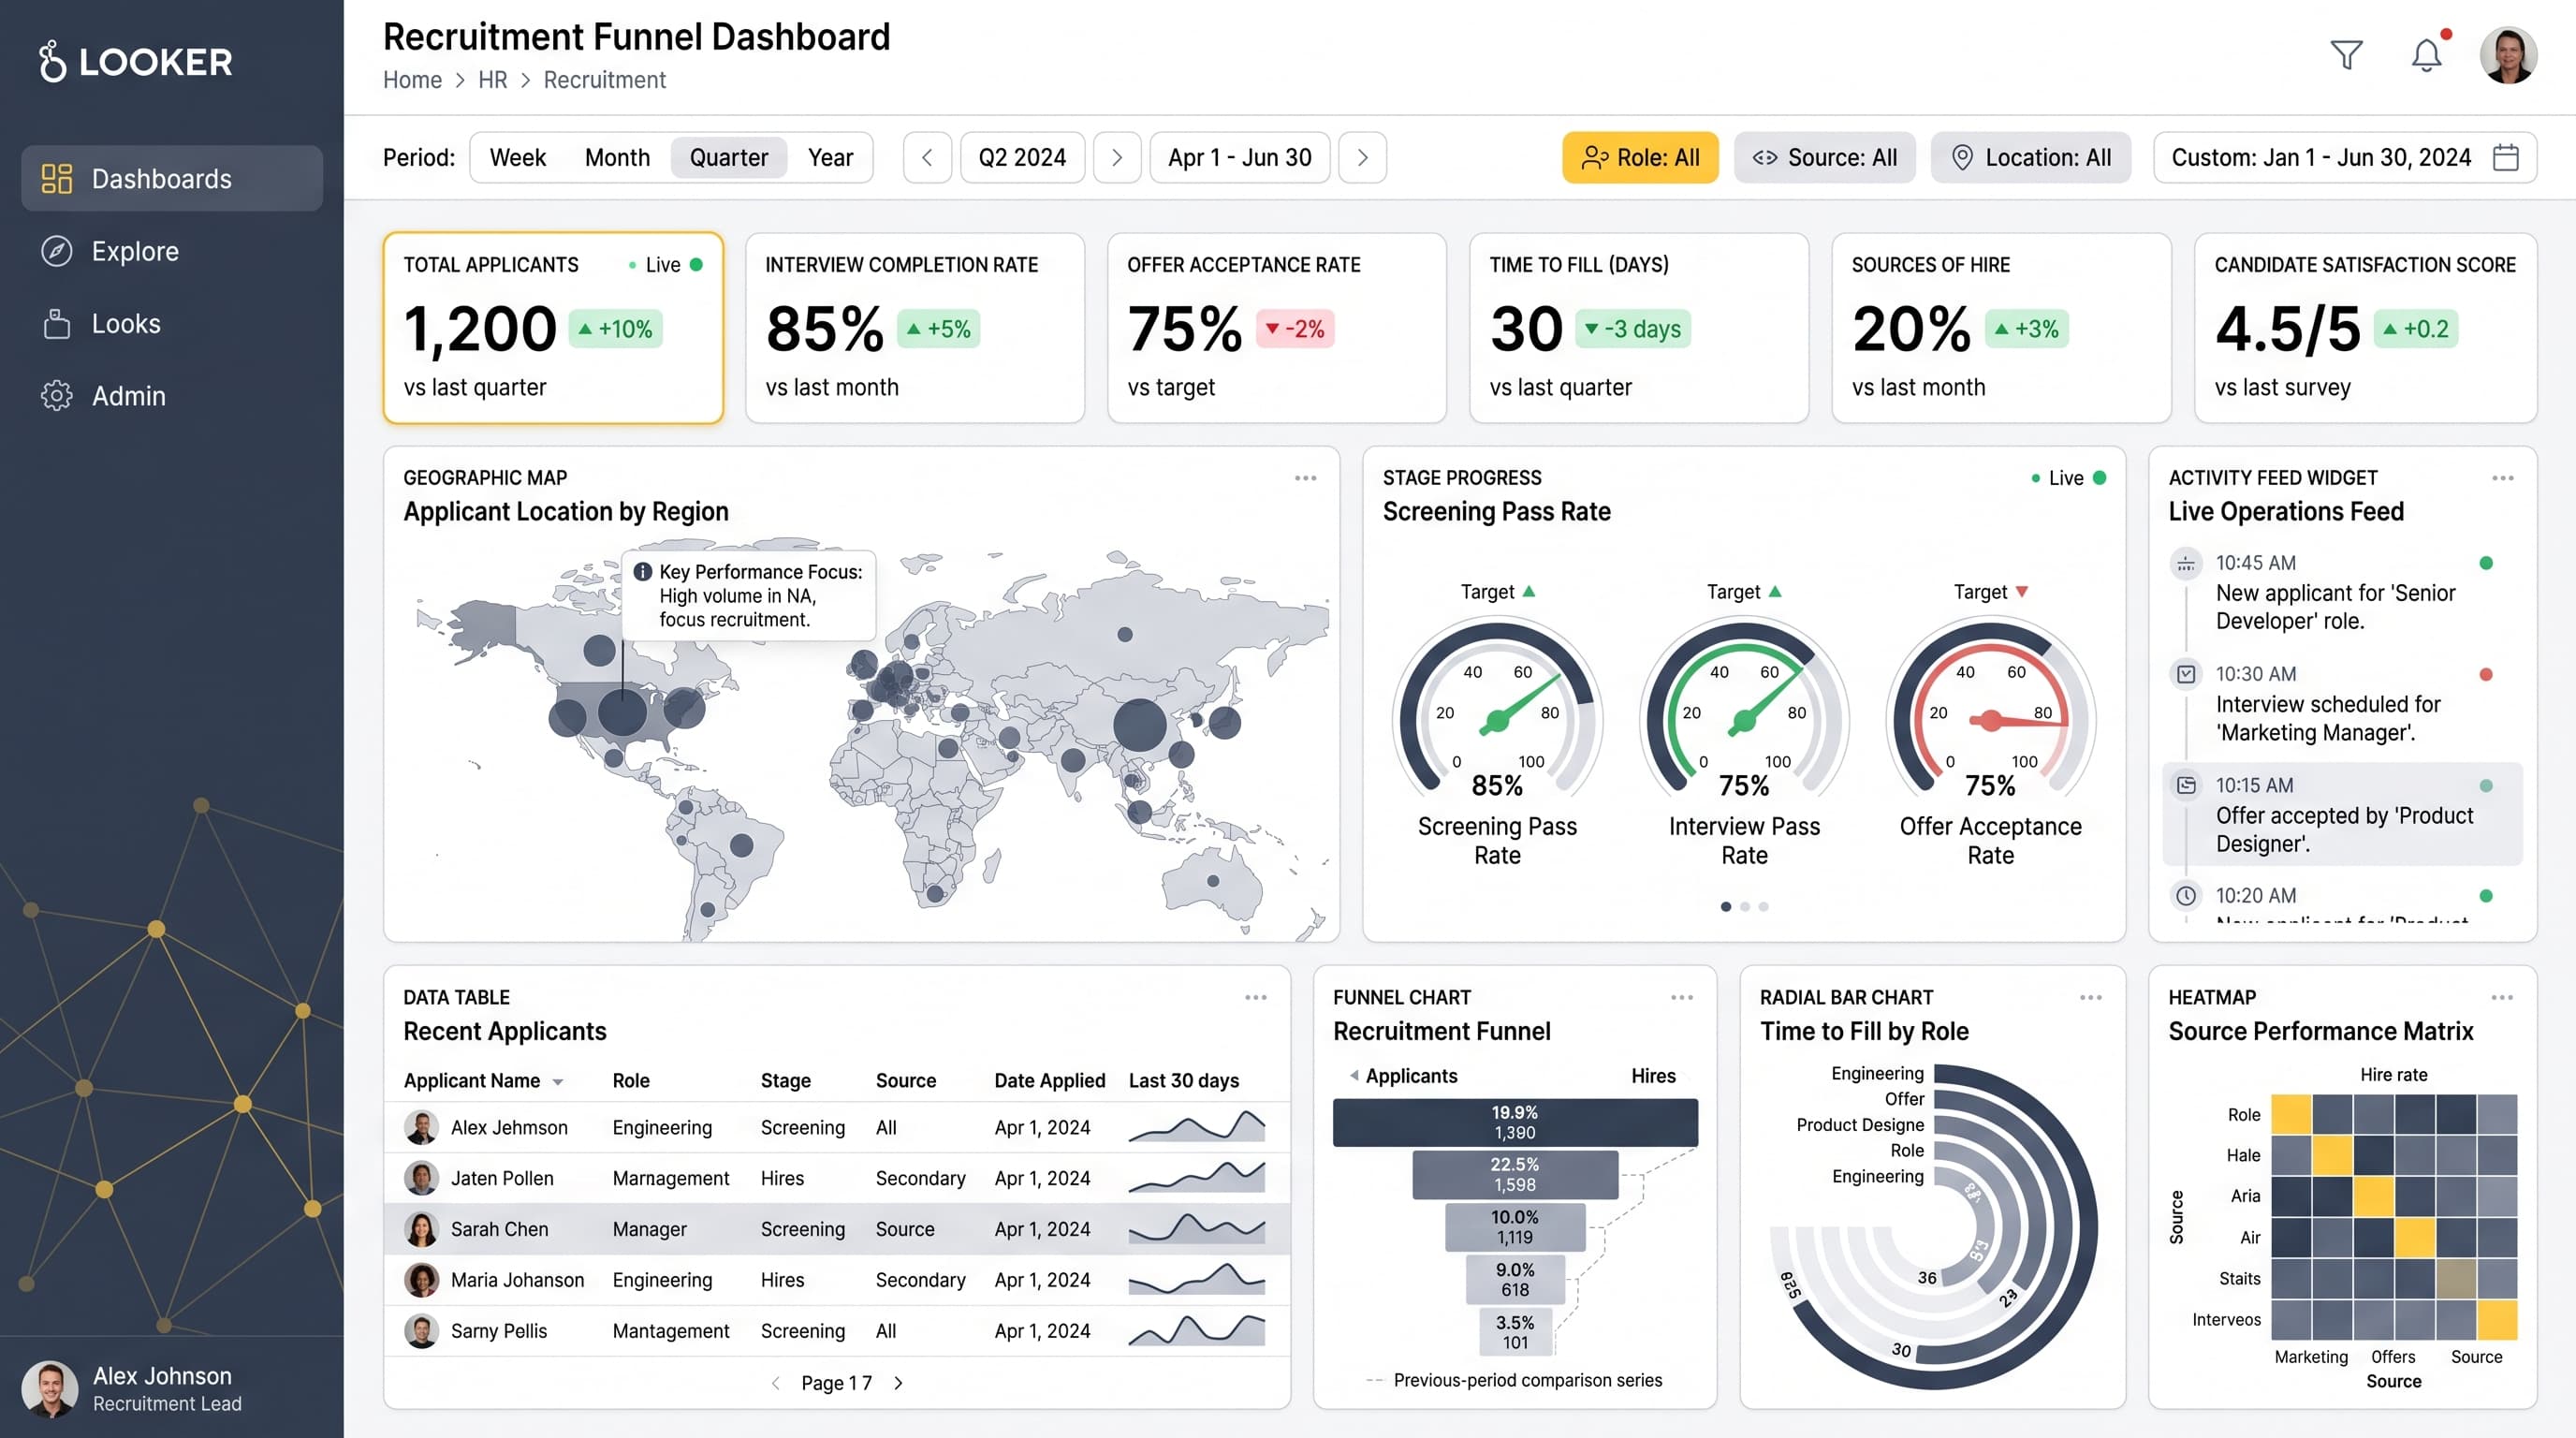
Analyze enrollment trends, graduation rates, and course completion metrics to enhance academic programs and boost student success.
KPIs tracked
Charts
Strategic insights
Design recommendations
Color Palette Strategy
HighUtilize the graphite-lime palette to create a fresh, engaging interface. Use light backgrounds for clarity, with lime for key highlights and metrics. Ensure all text maintains a 4.5:1 contrast ratio for accessibility.
Layout & Grid System
HighAdopt a 12-column grid for a 16:9 layout. Place KPIs in the top row for immediate visibility, charts in the middle for analysis, and filters in a sidebar. Ensure 16-24px padding around cards and 16-20px gaps between elements.
Typography Hierarchy
MediumUse a clear hierarchy: Dashboard title at 28px bold, section headers at 20px semibold, card titles at 16px medium, and body text at 14px regular. Stick to one font family like Inter for consistency throughout the dashboard.
Data Visualization UX
HighSelect visualization types that fit the data: Multi-Line Charts for trends, Stacked Bar Charts for comparisons, and Donut Charts for proportions. Limit color use to 5-7 per chart and provide tooltips with context.
Visual Hierarchy & Focus
MediumCreate a clear visual hierarchy by emphasizing the most important metrics with larger font sizes and bold styling. Use whitespace effectively to separate sections and apply conditional formatting to highlight anomalies in data.
Interaction & Feedback
LowImplement hover states for interactive elements to enhance user engagement. Use loading indicators during data refresh, and provide clear visual feedback on filter interactions. Consider drill-through capabilities for deeper data exploration.