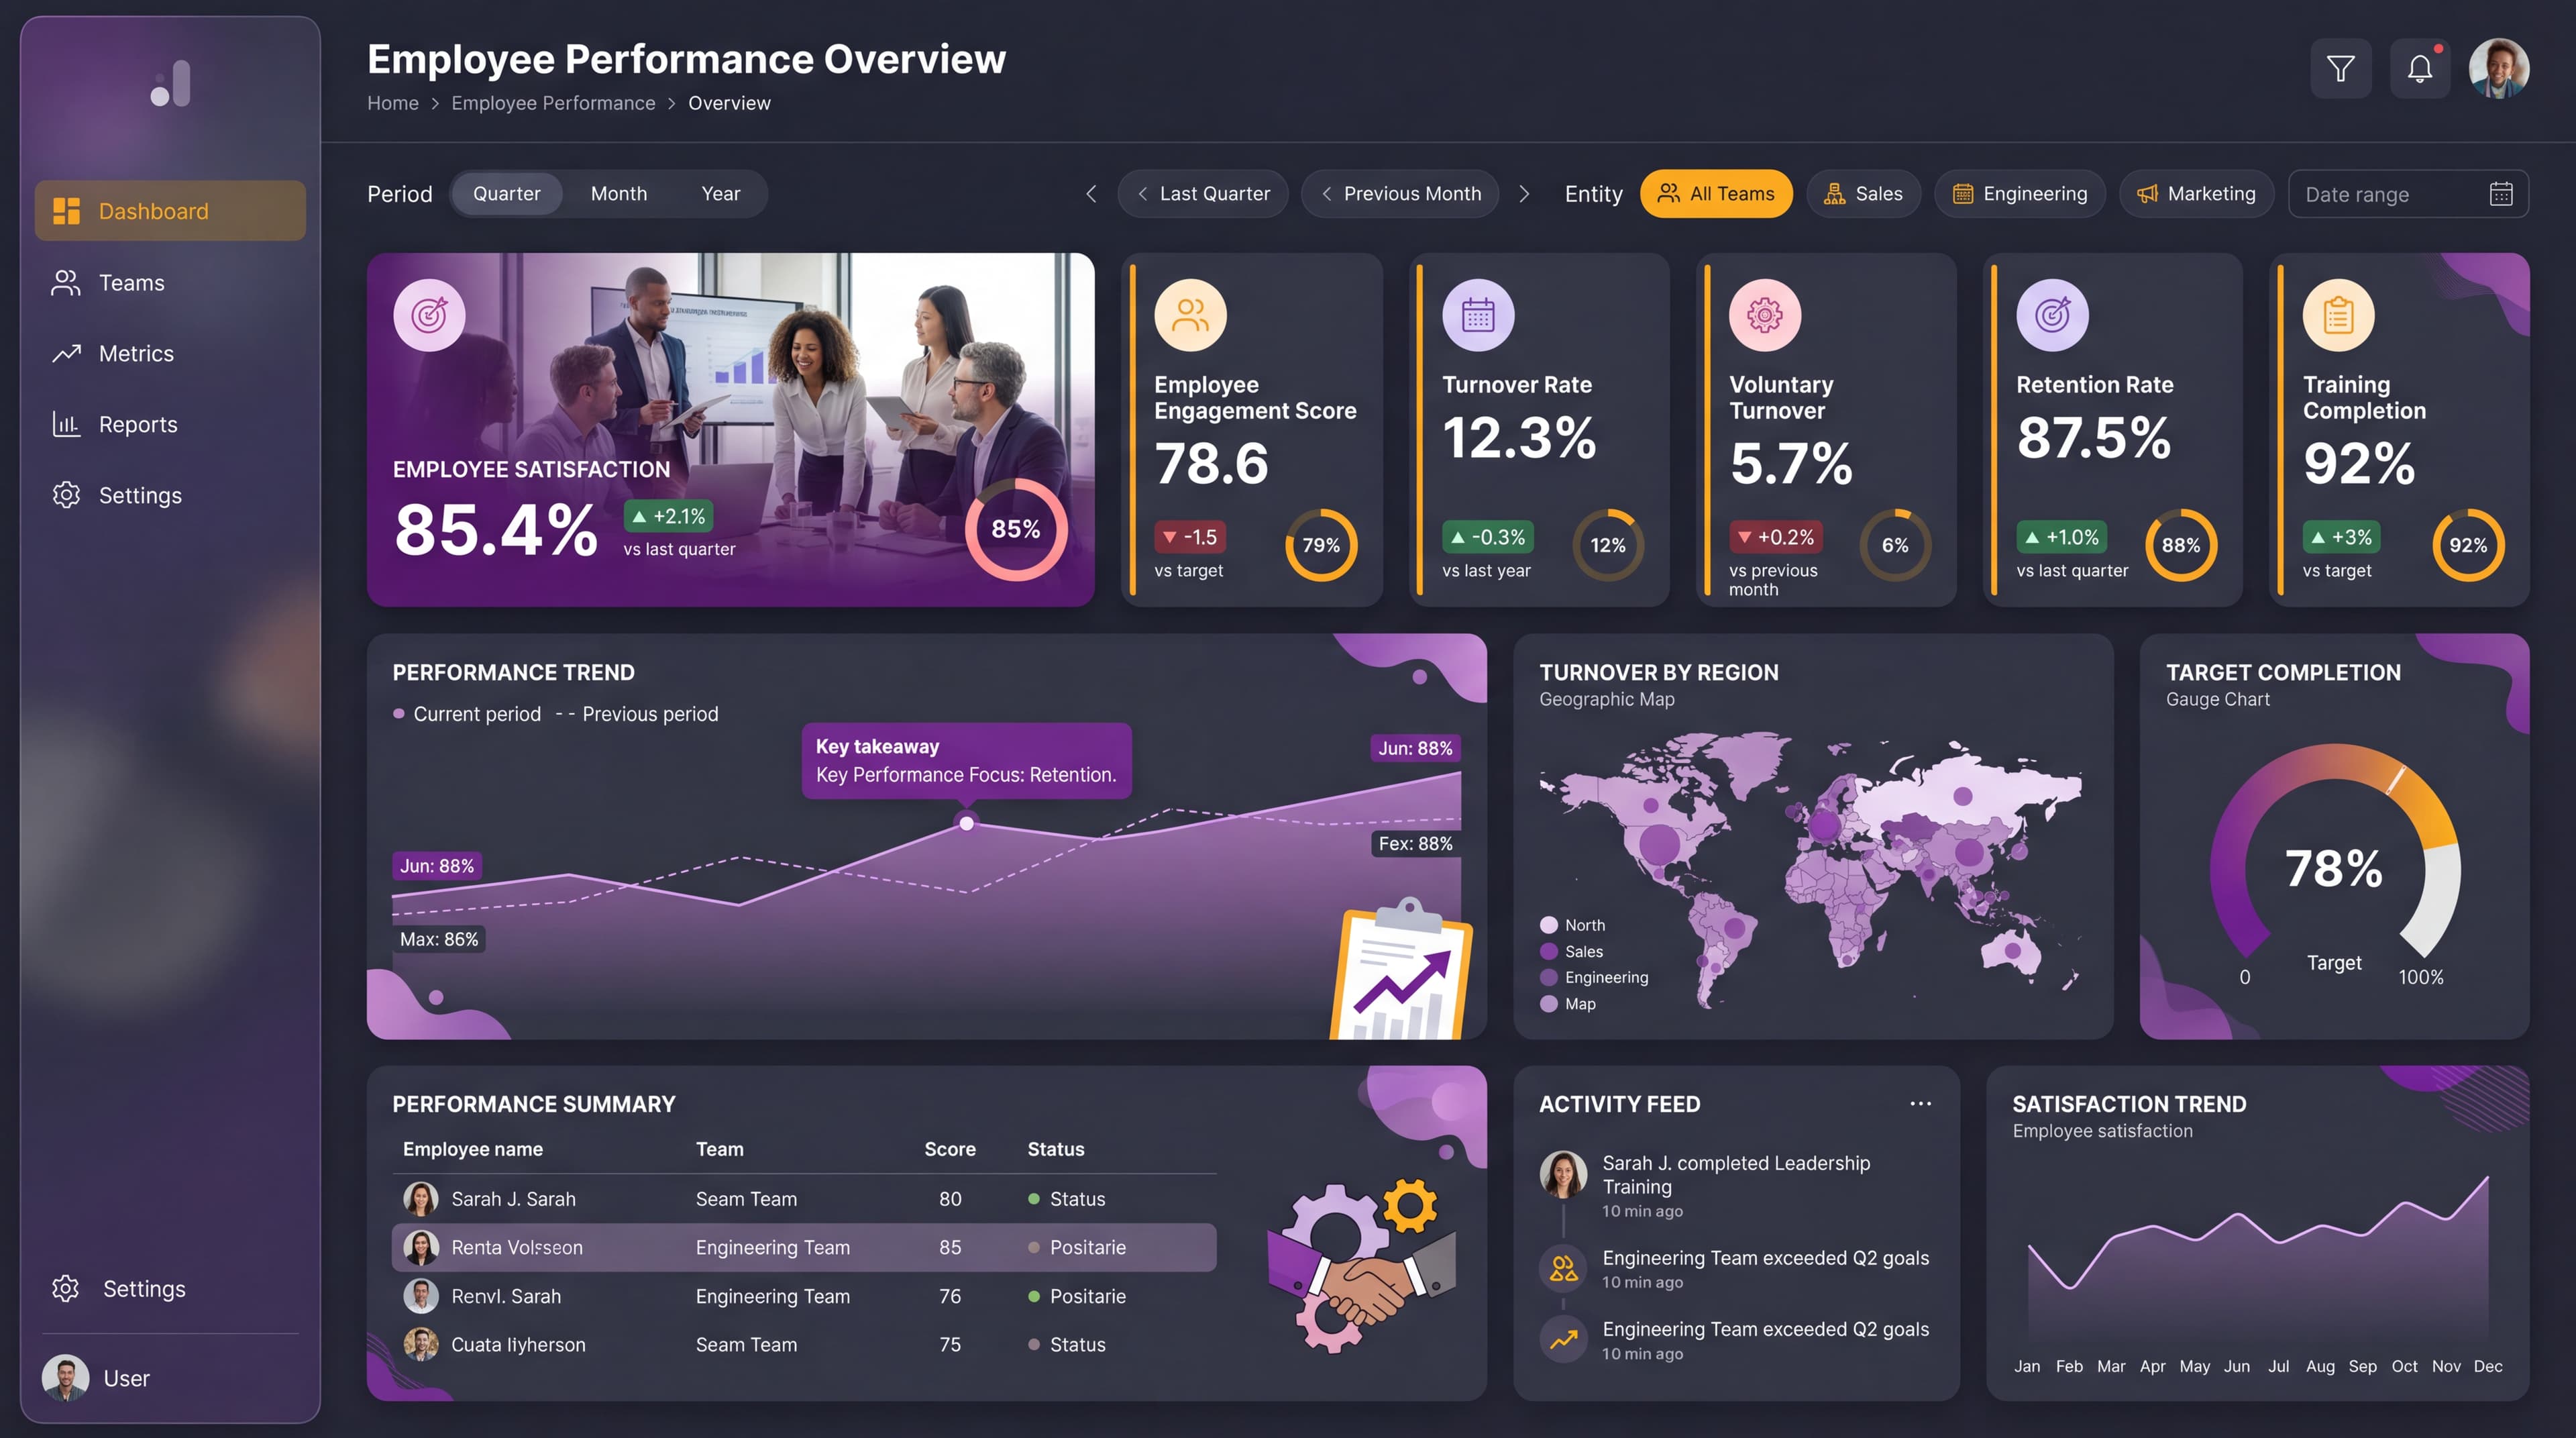
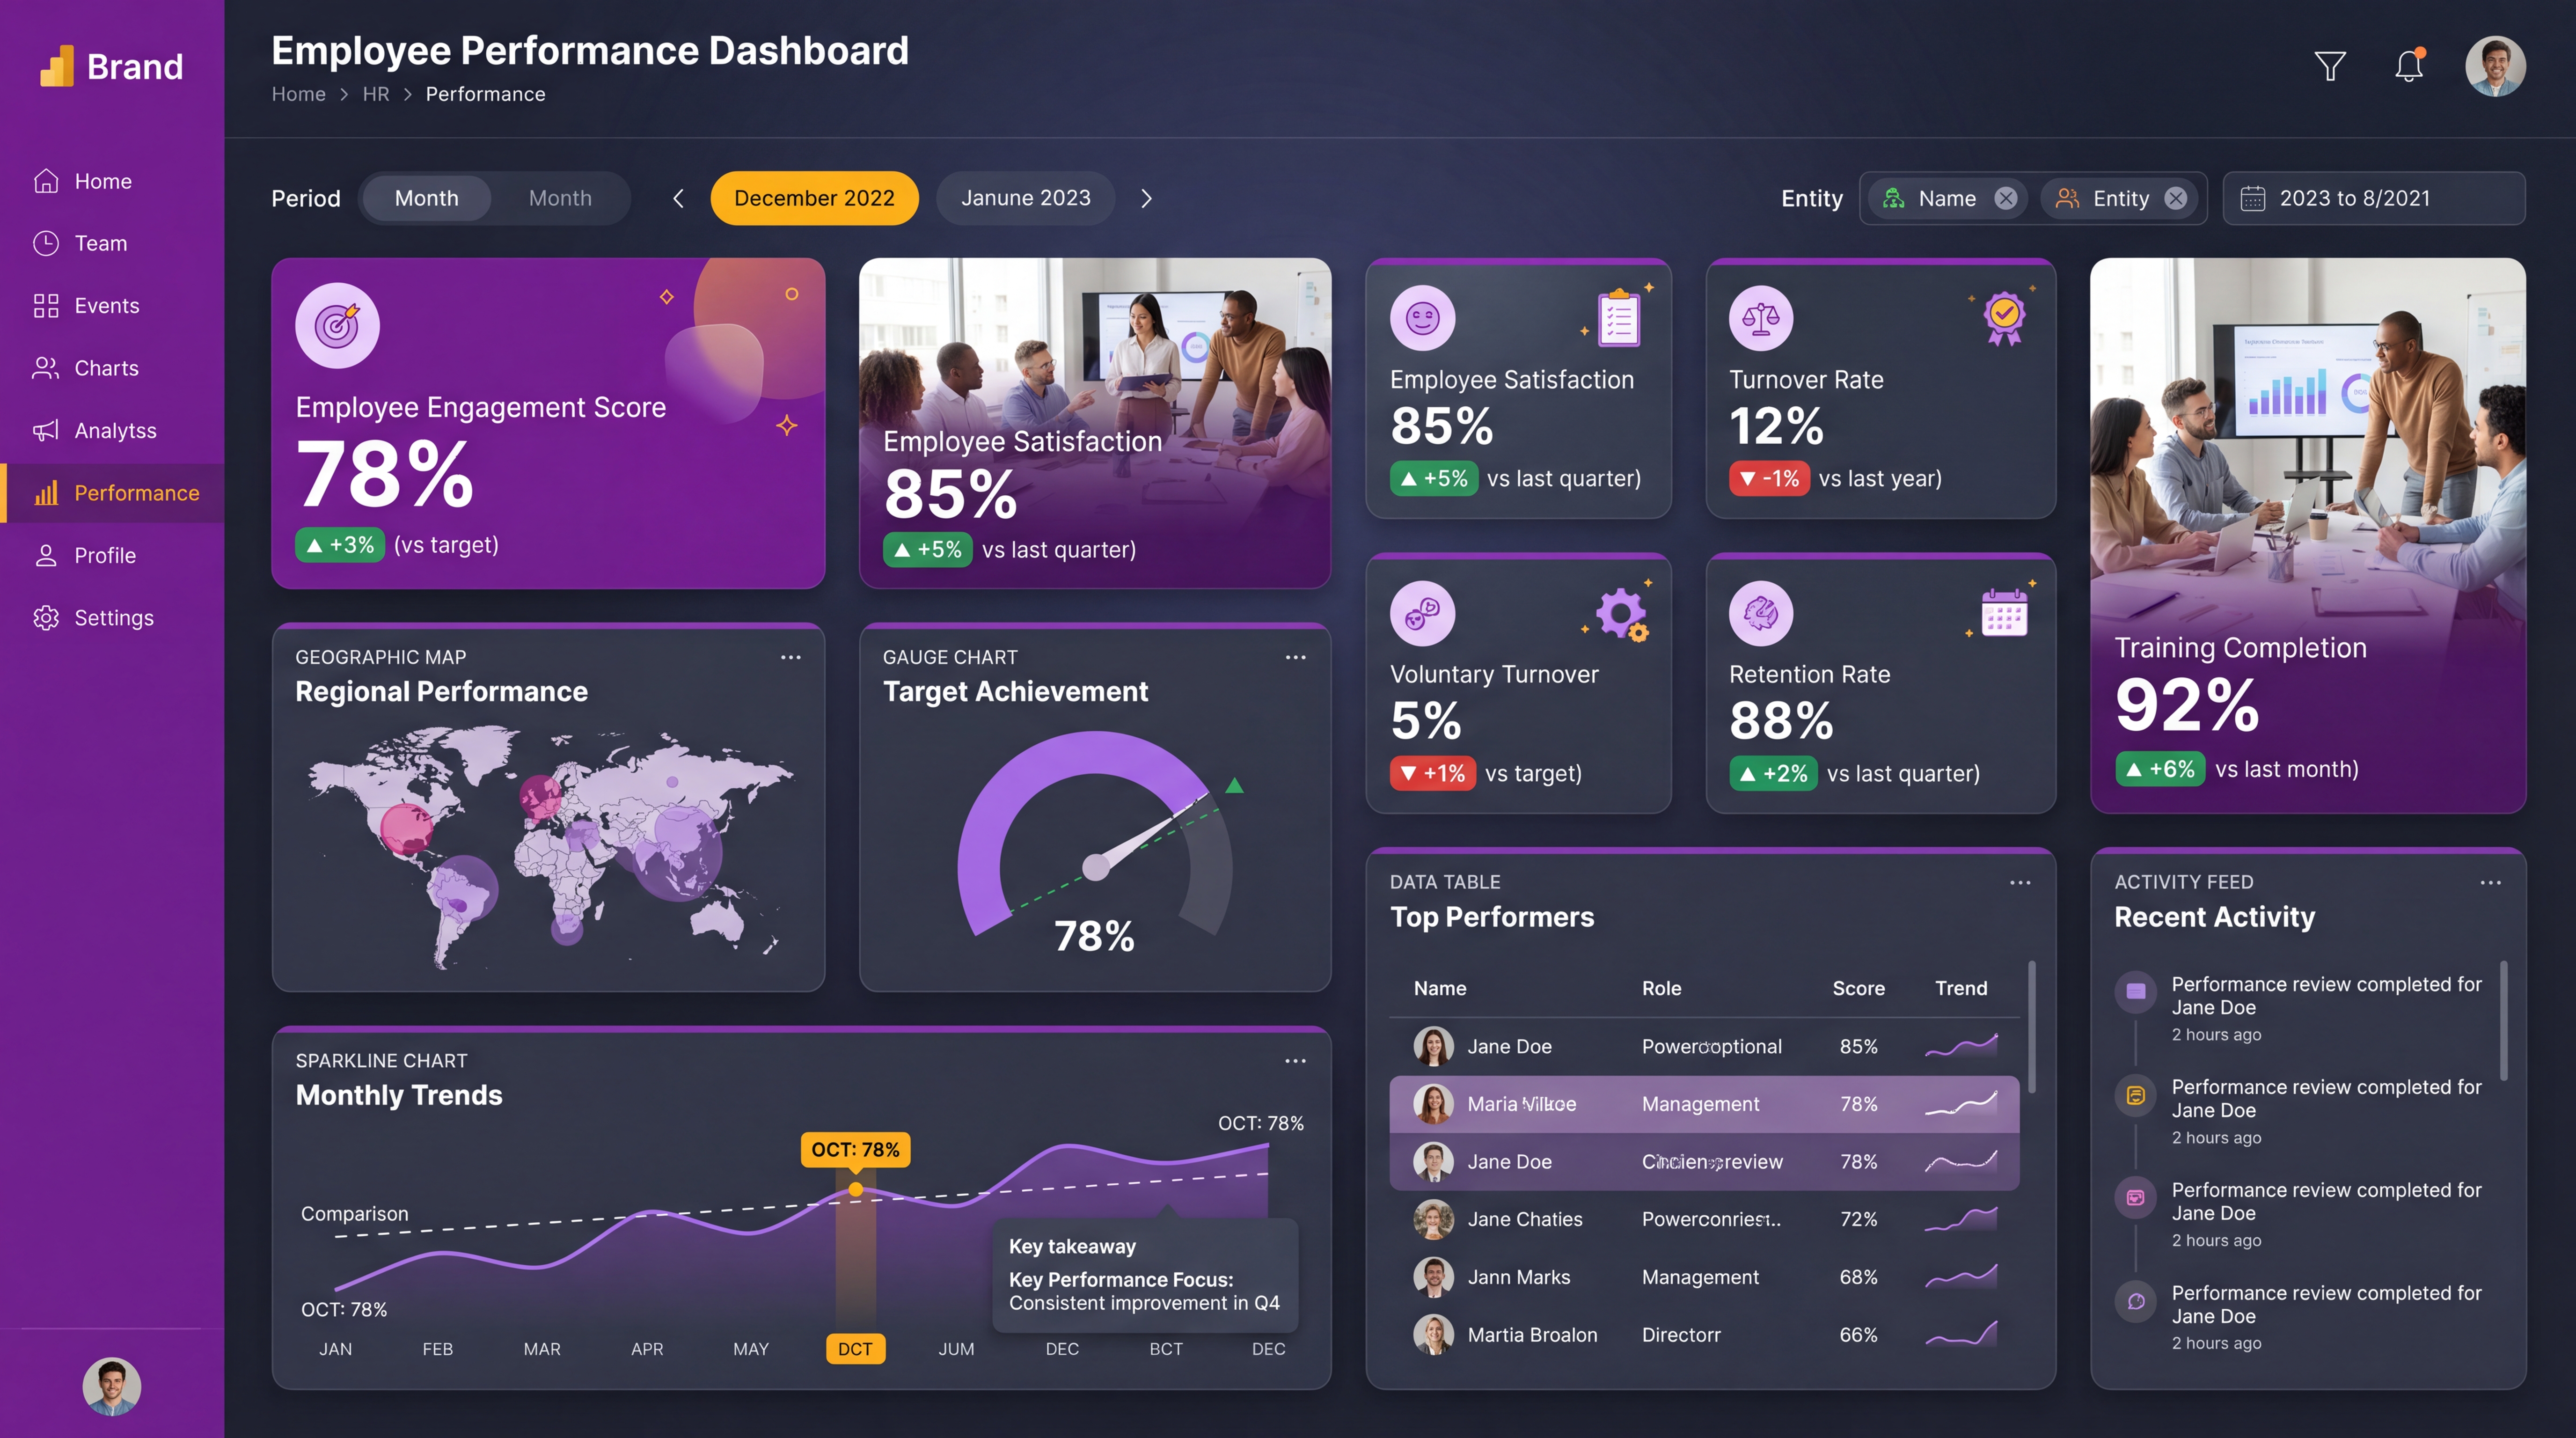
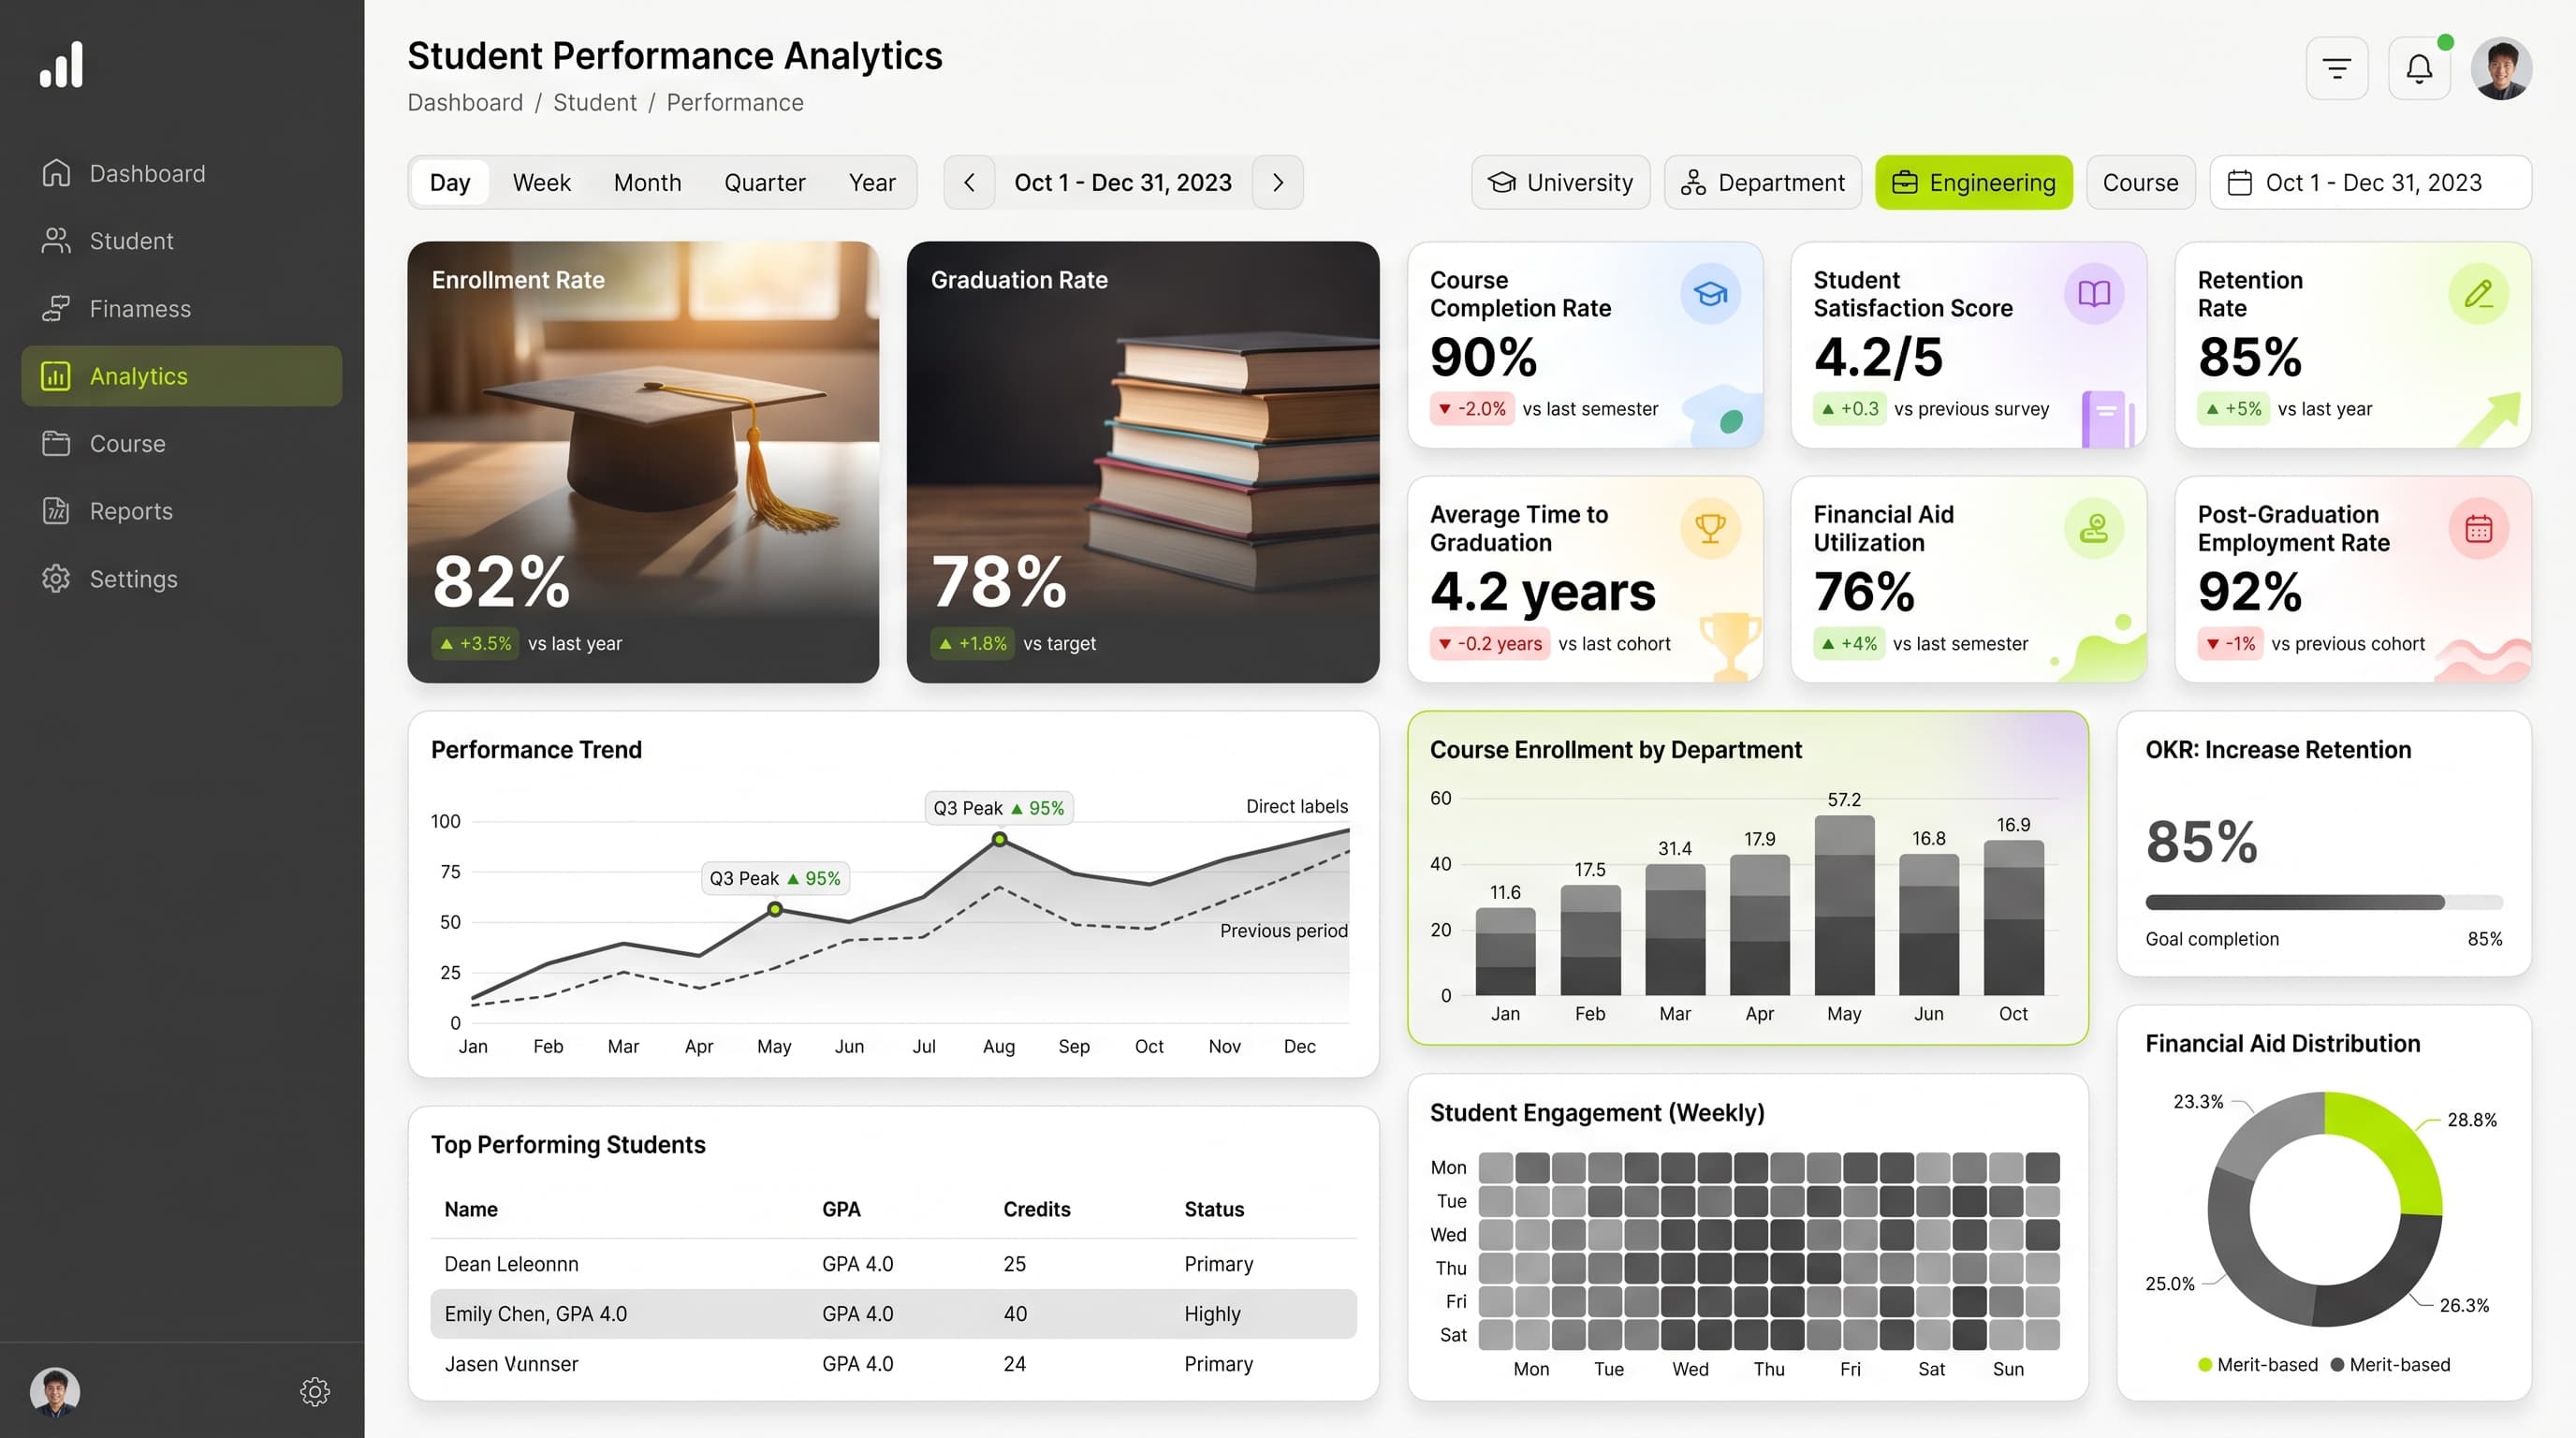
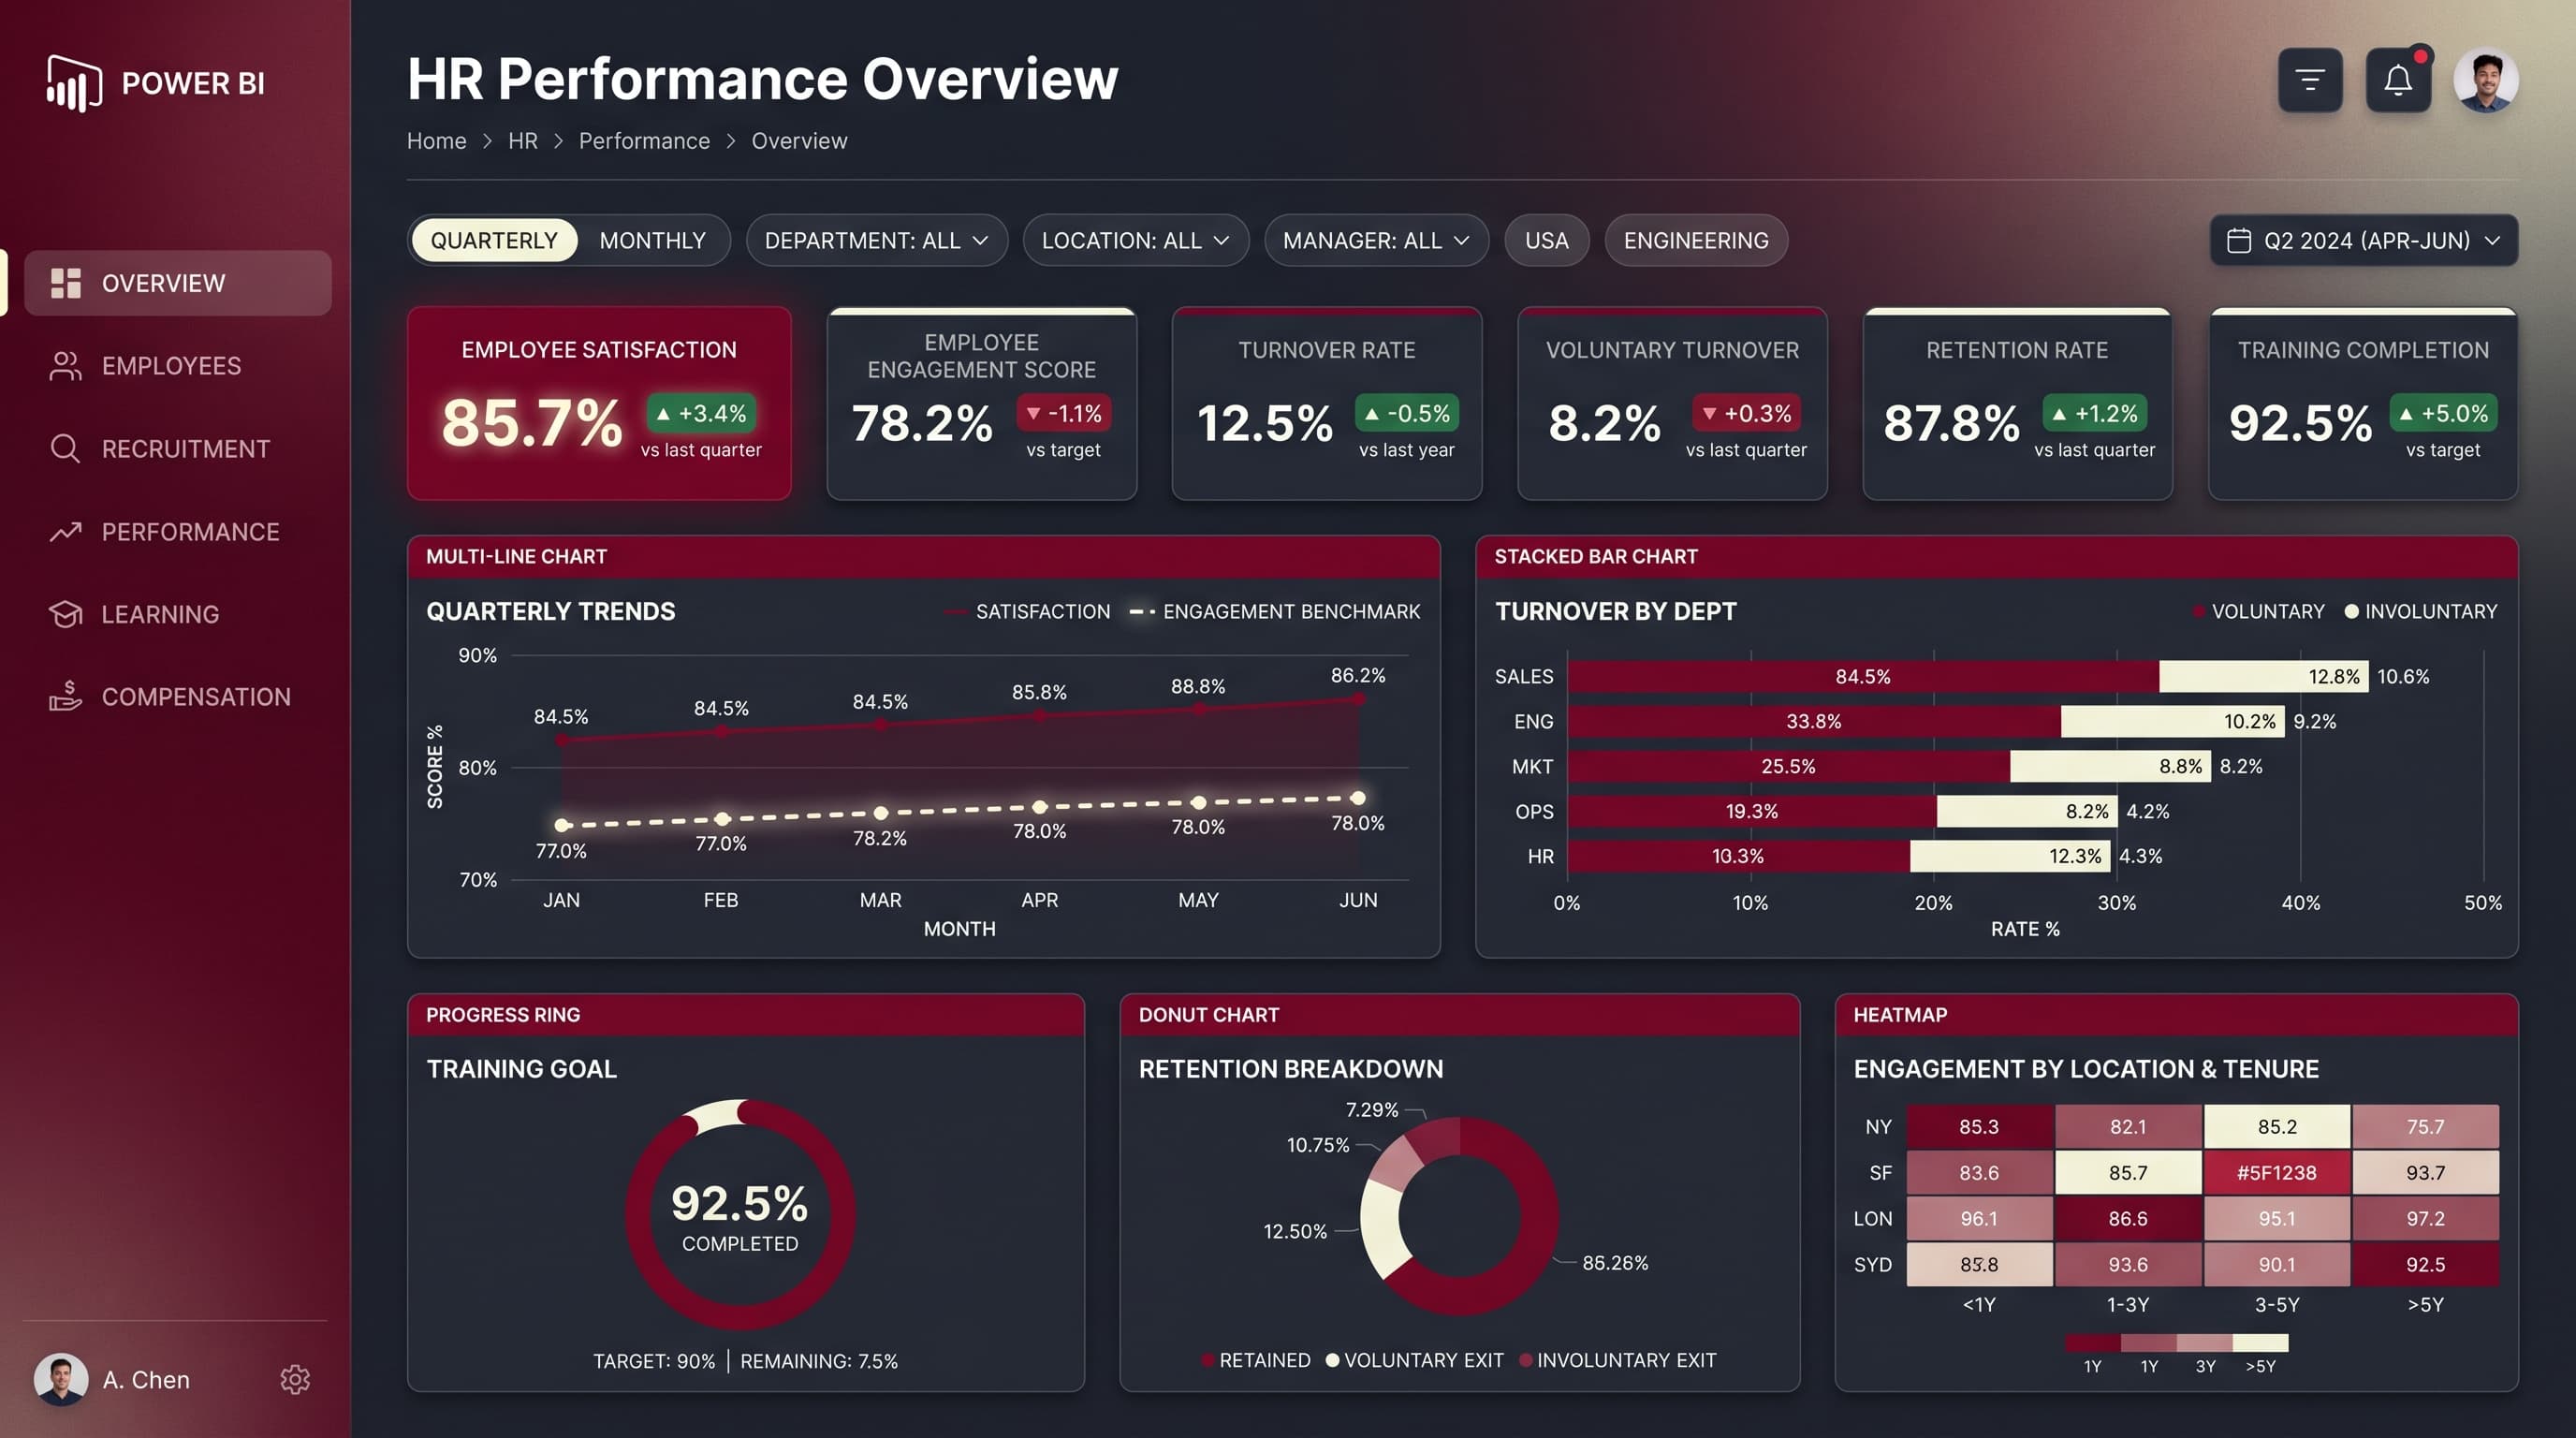
About this dashboard
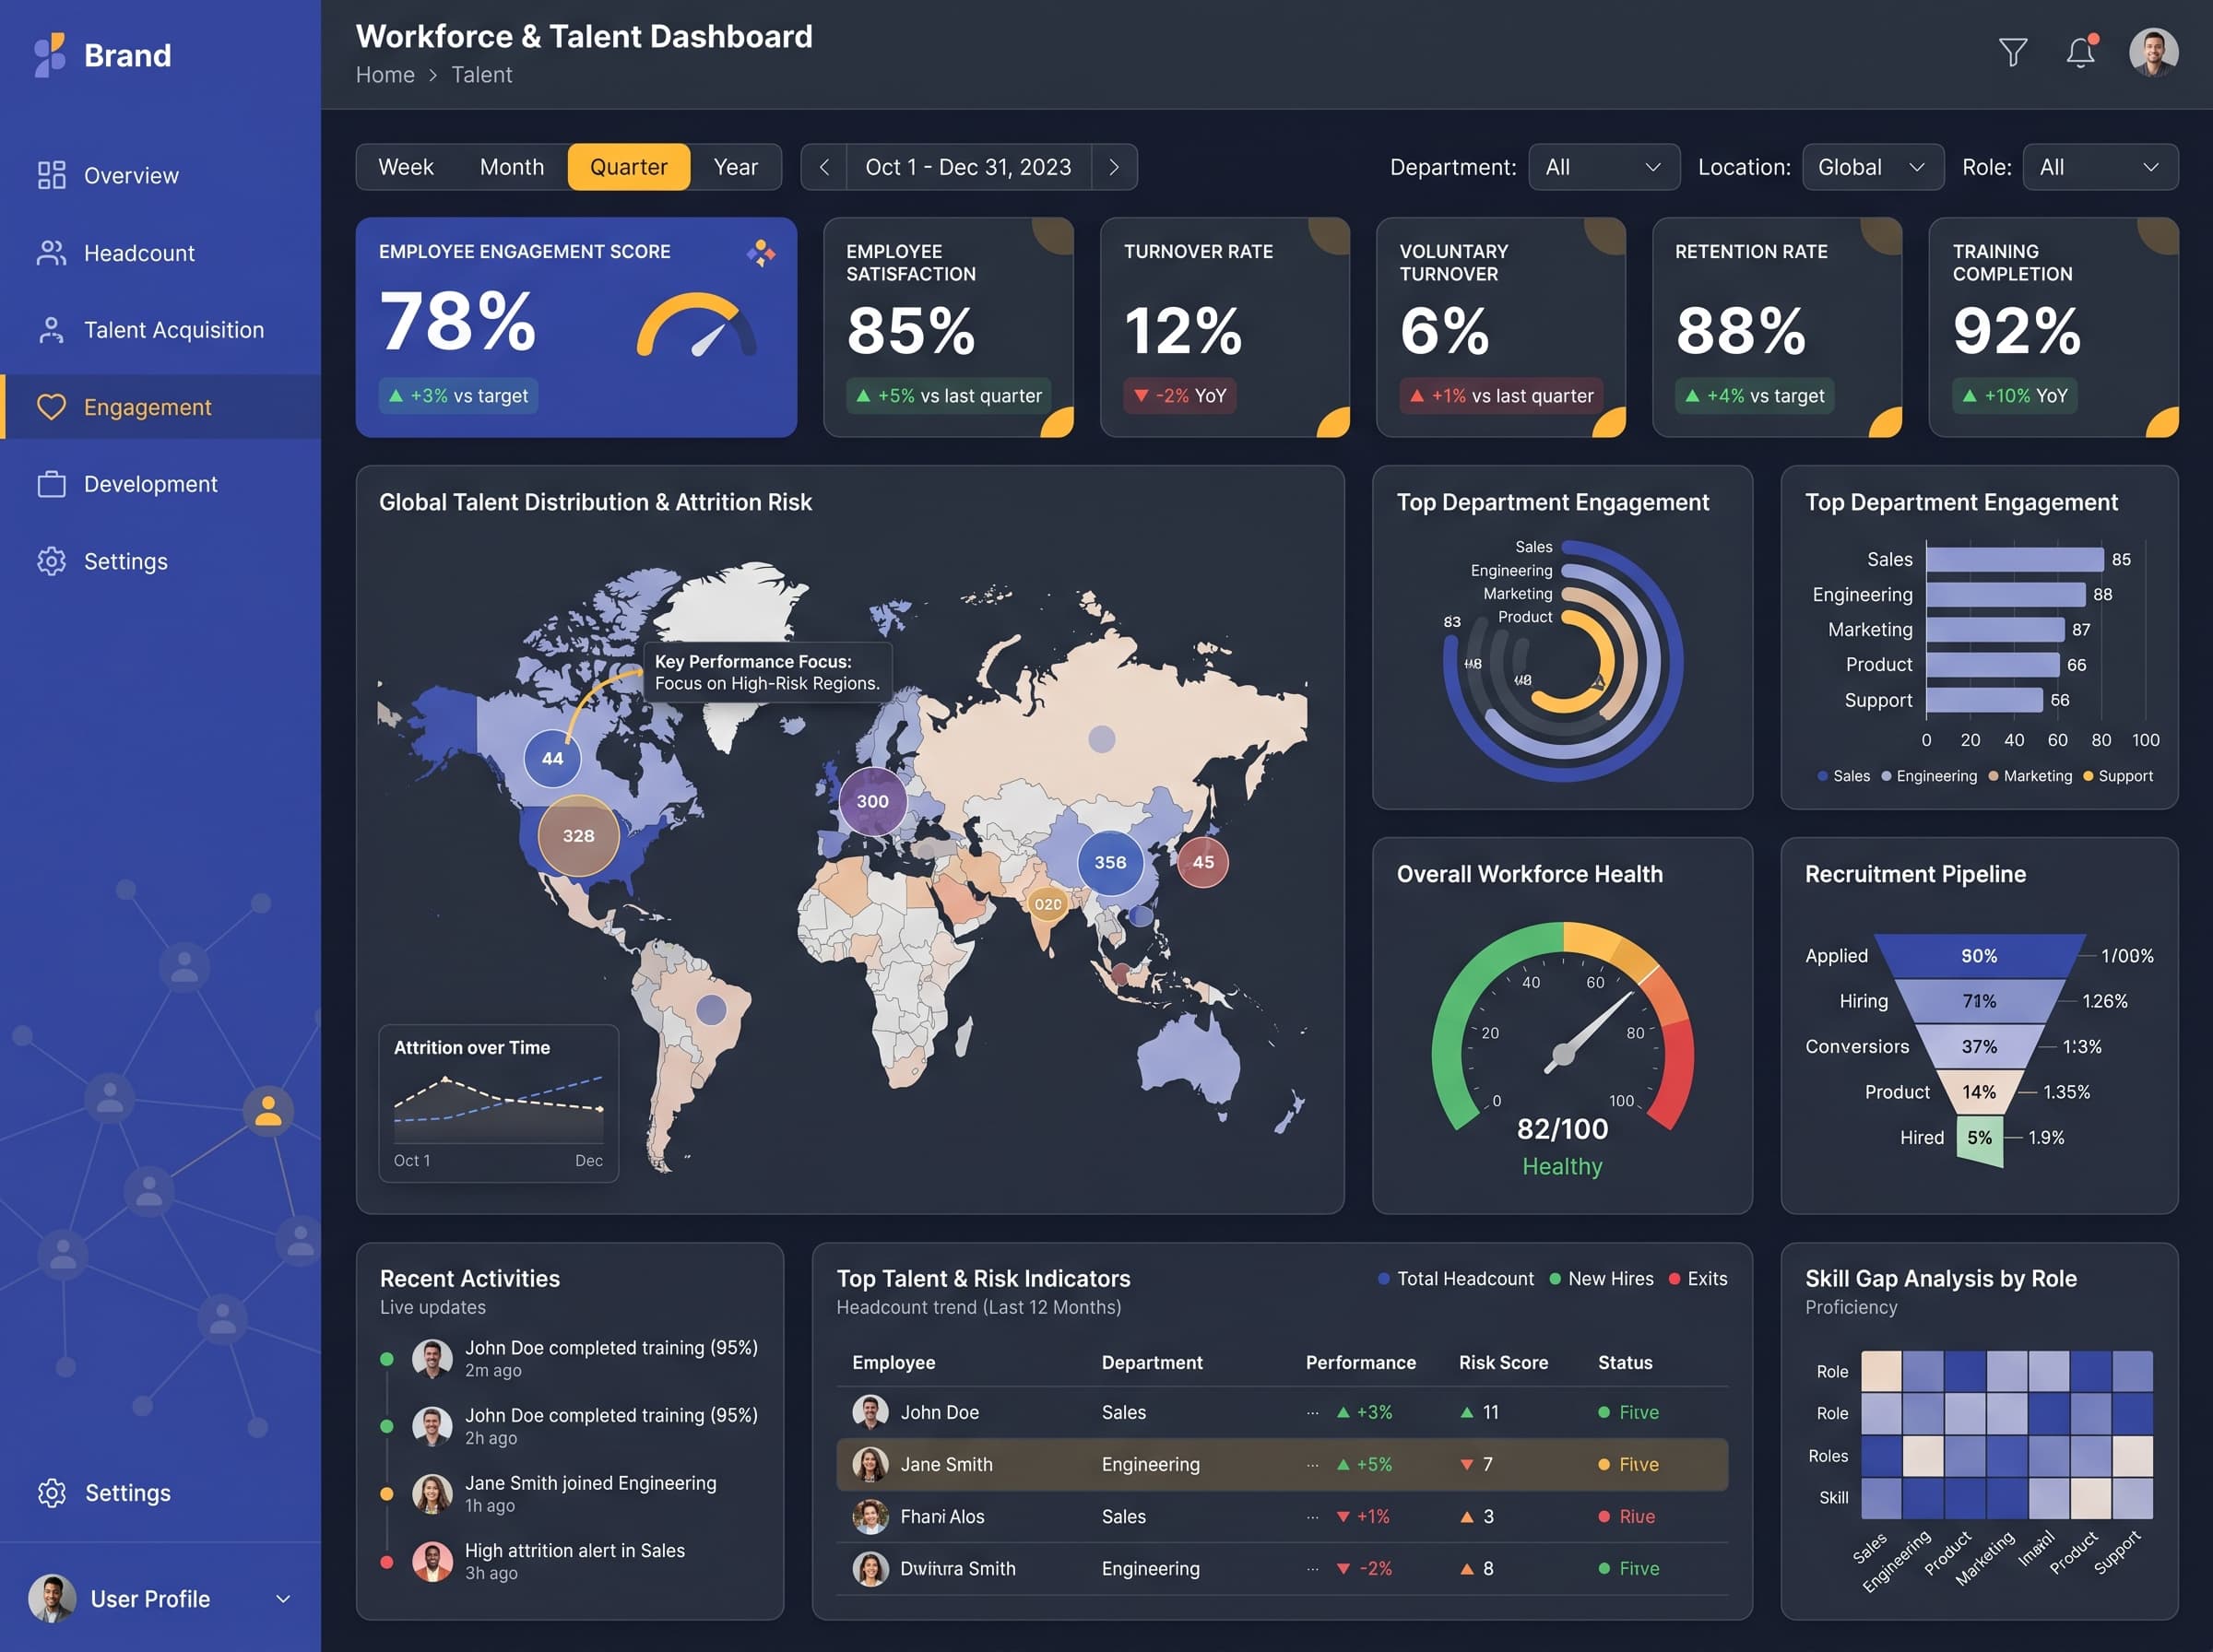
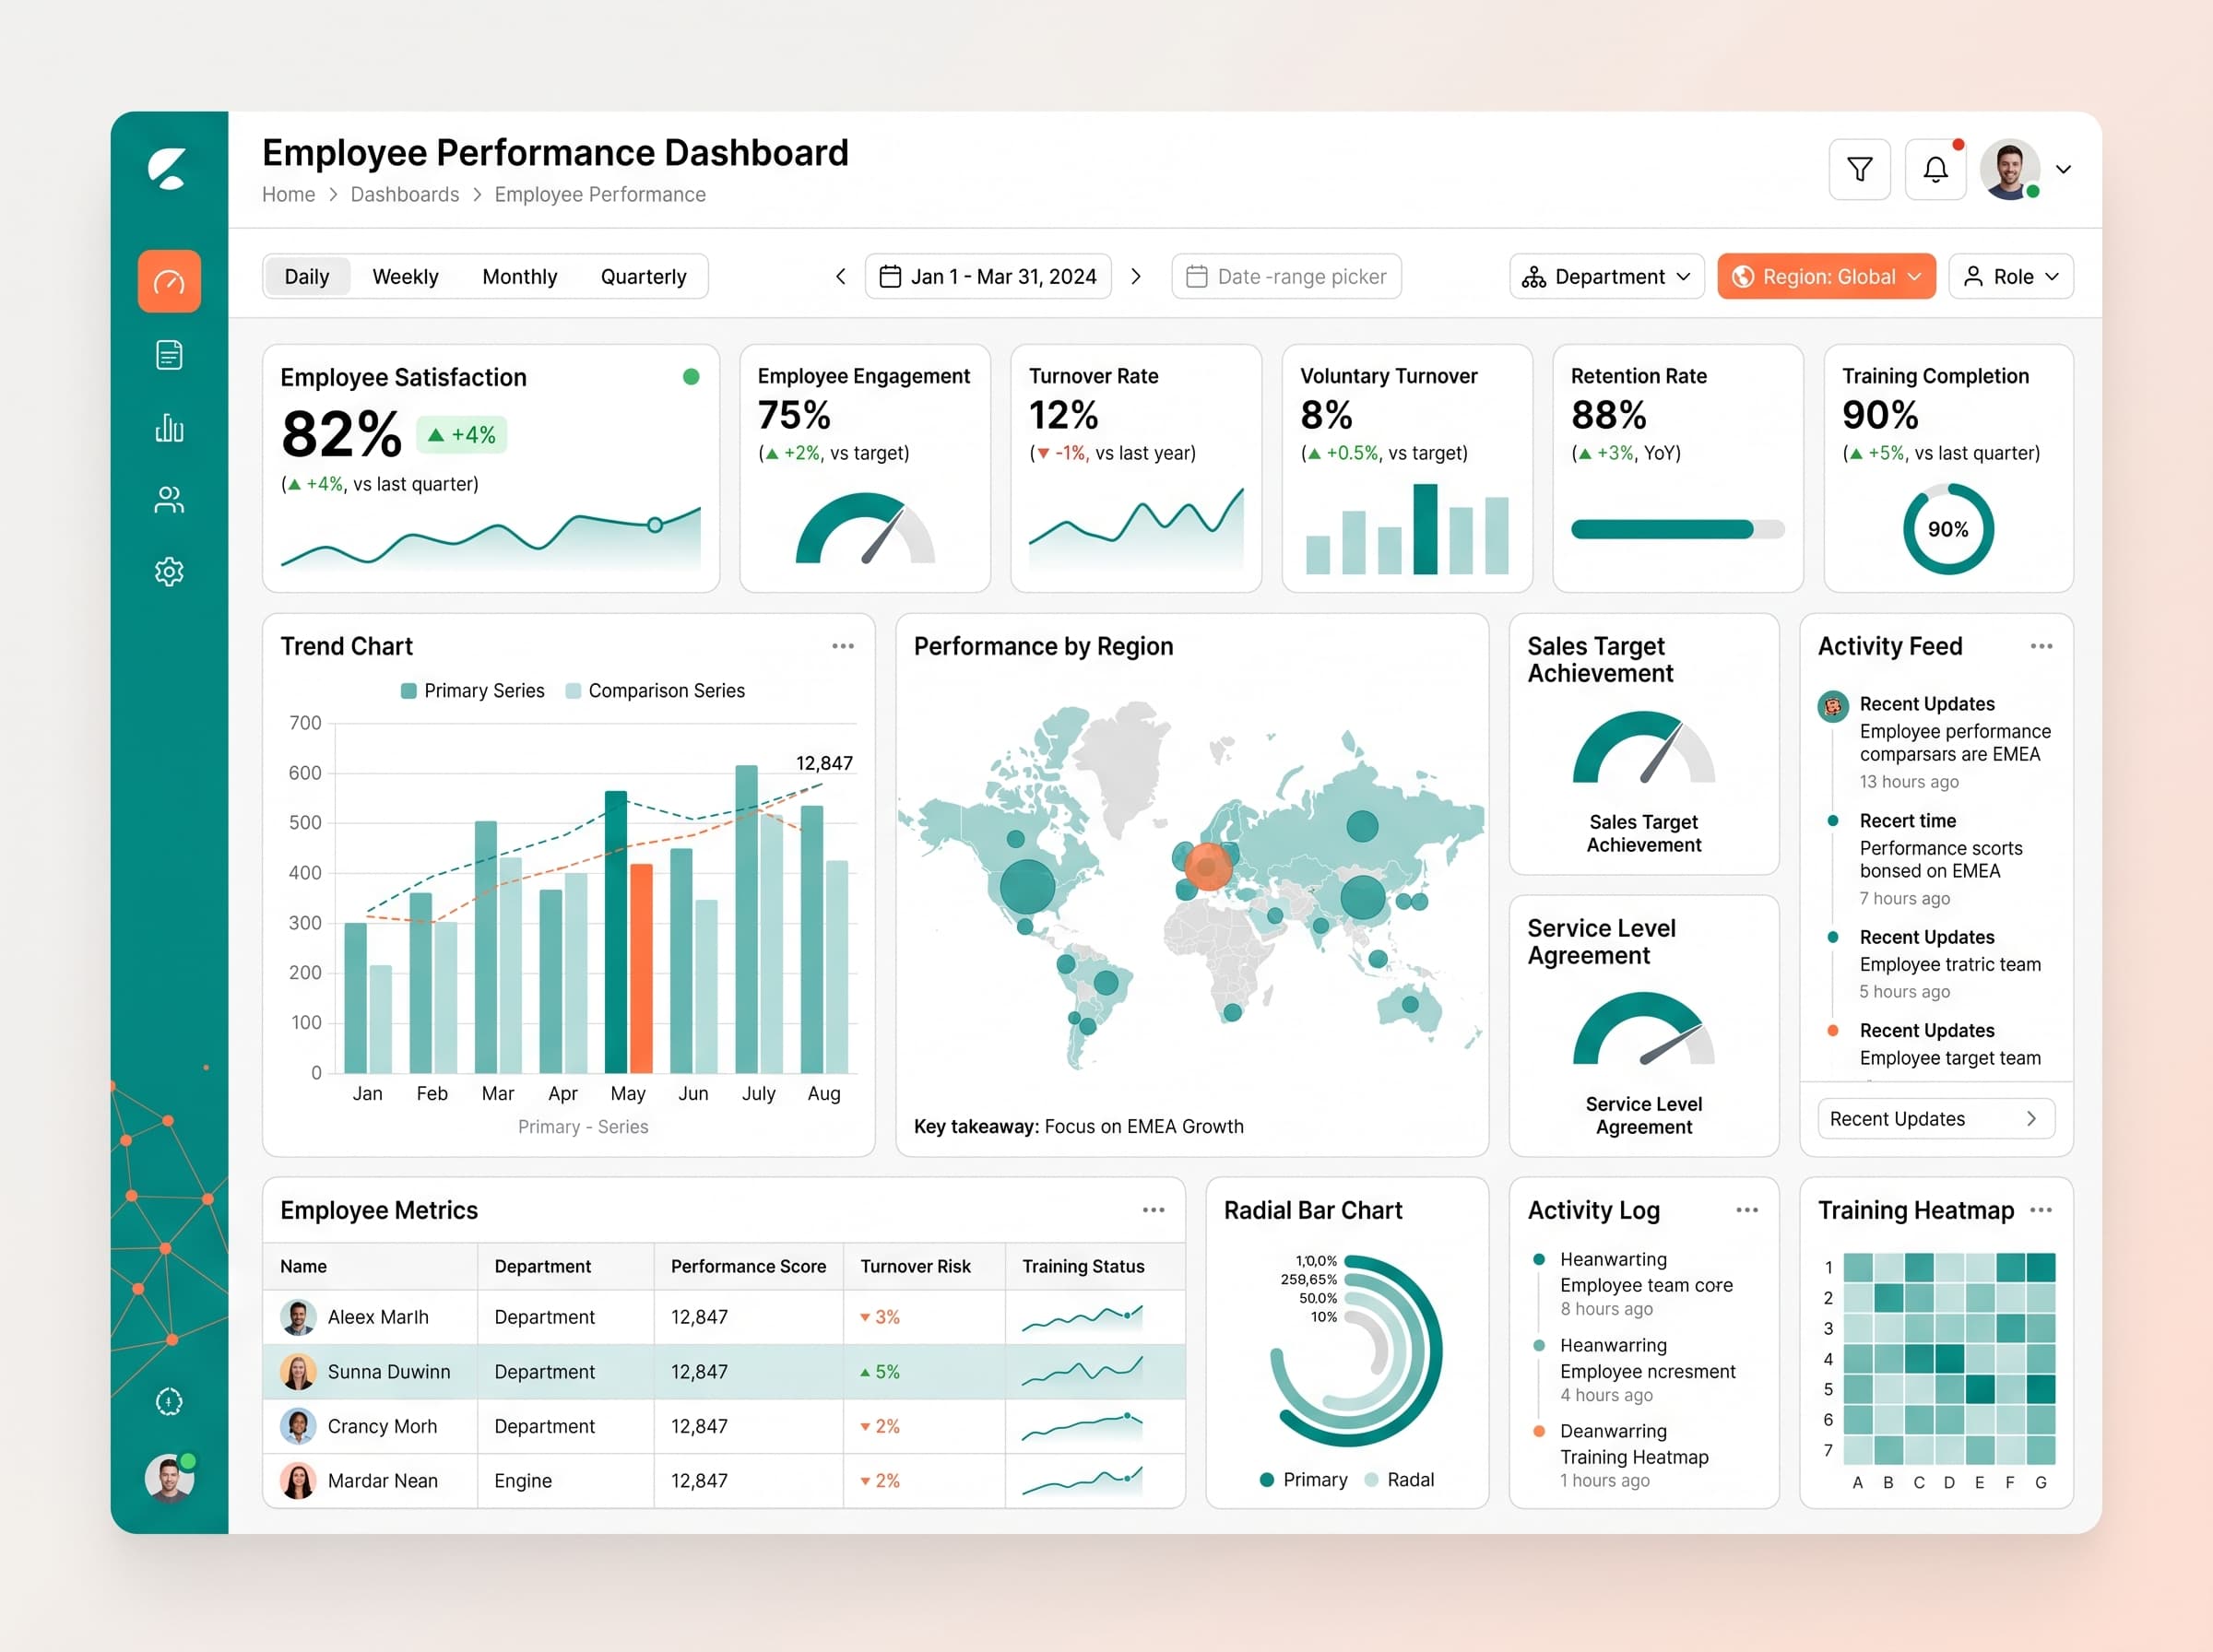
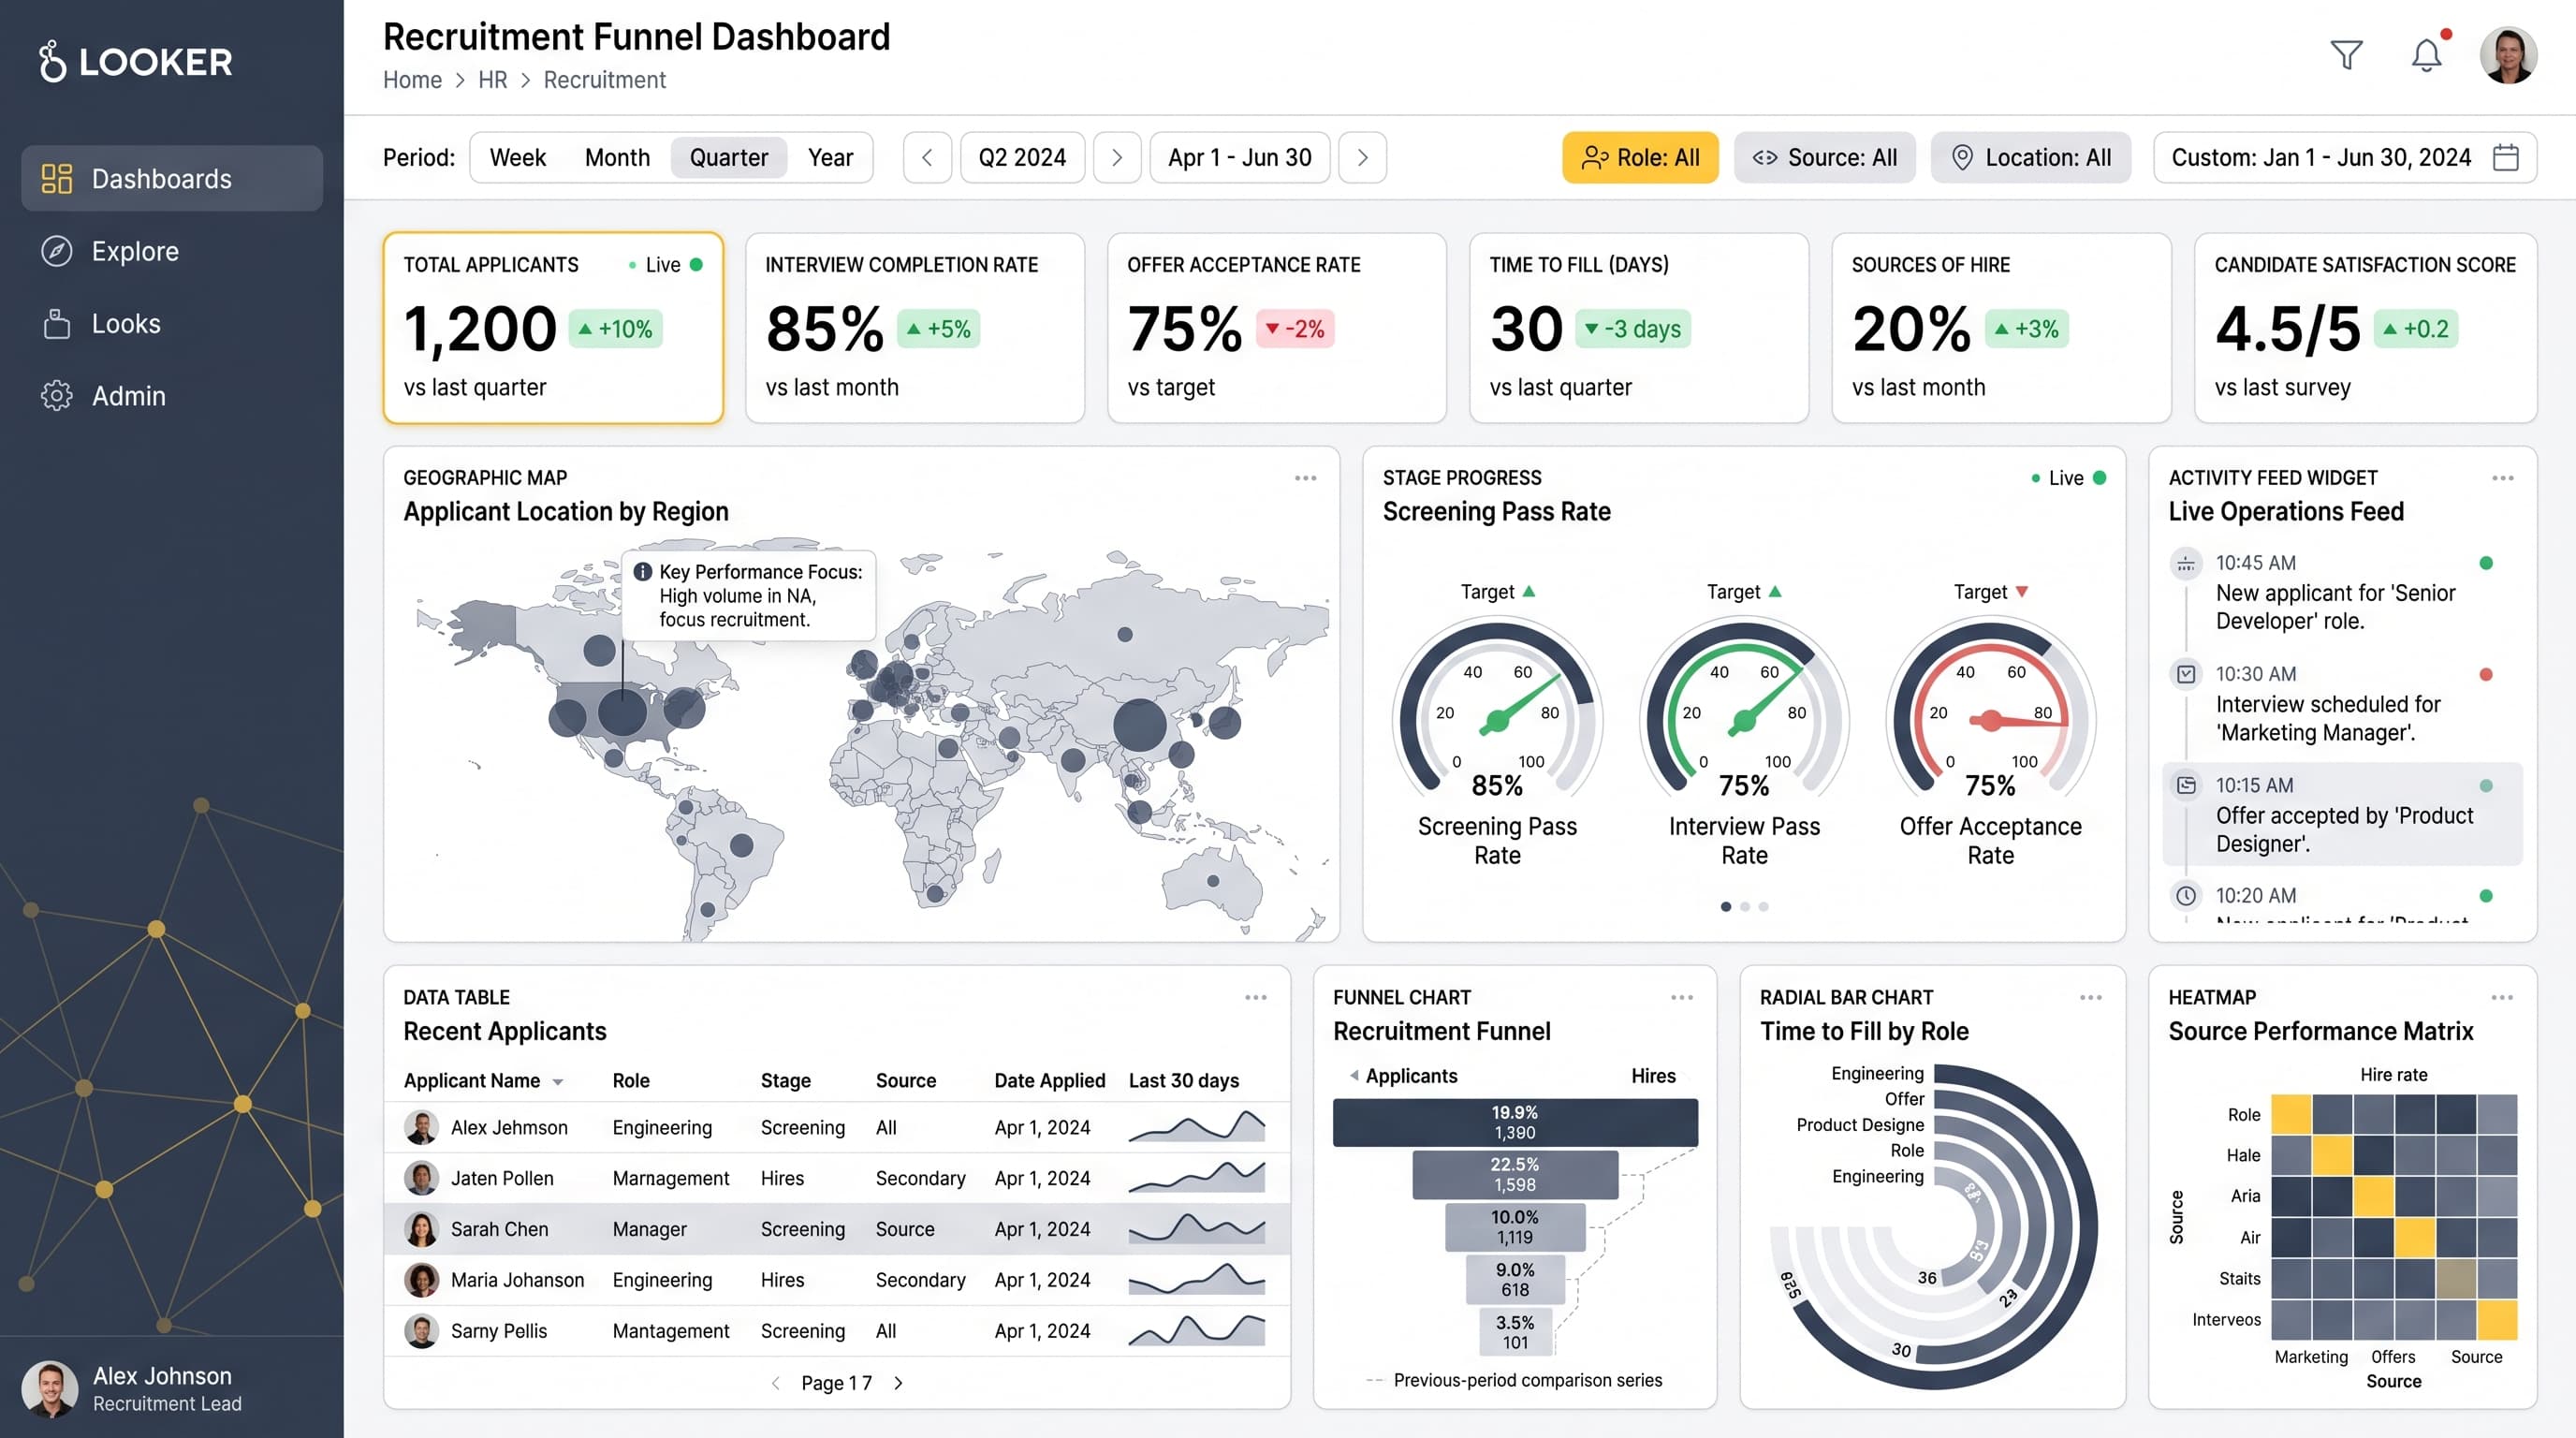
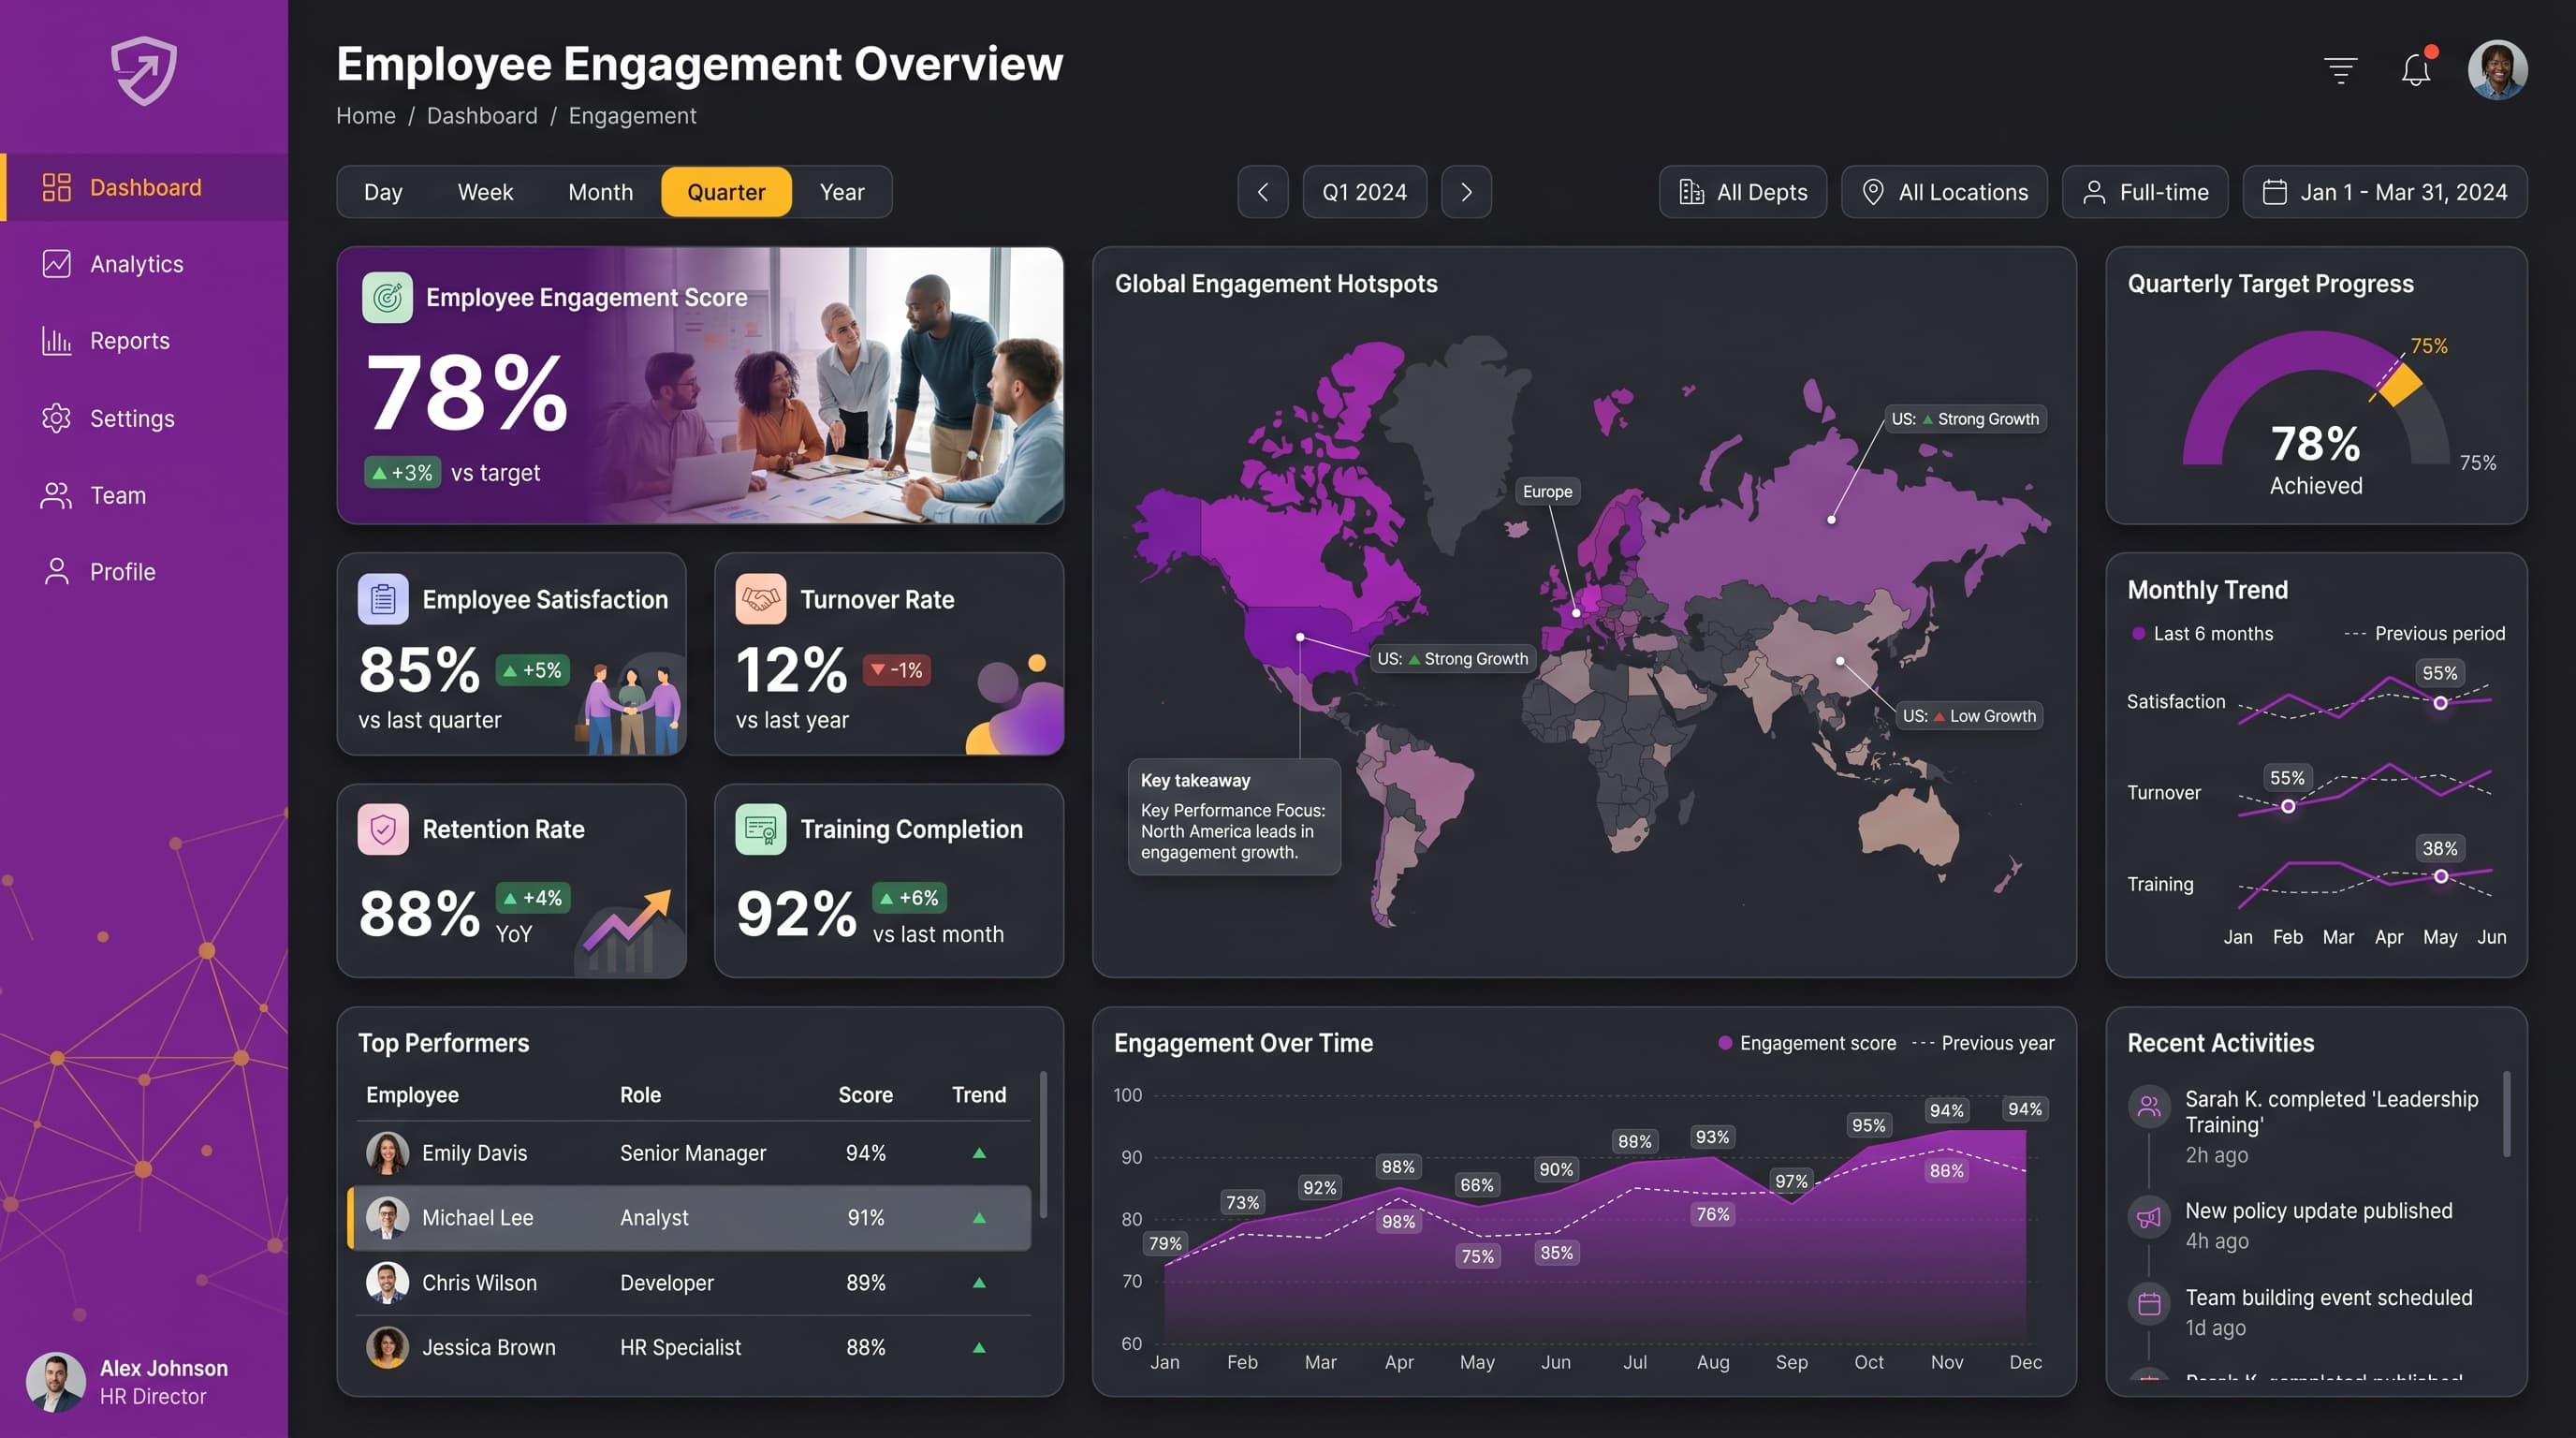
Track engagement scores, eNPS, attrition risk and retention by tenure and team.
KPIs tracked
Charts
Strategic insights
Design recommendations
Color Palette Strategy
HighUtilize a purple-gold color palette effectively by using purple for headers and navigation, gold for key metrics, and maintaining a 4.5:1 contrast ratio for accessibility. This consistency aids in visual recognition.
Layout & Grid System
HighImplement a 12-column grid for a 2x2 layout, placing KPIs at the top for visibility. Charts should occupy the middle sections, with adequate padding and spacing to enhance readability.
Typography Hierarchy
MediumEstablish a clear typography hierarchy: Dashboard title at 24-28px bold, section headers at 18-20px semibold, and body text at 12-14px regular. Consistency in font (like Inter) is key for readability.
Data Visualization UX
HighSelect a scatter plot for analyzing relationships between engagement scores and turnover, a radial bar chart for visualizing retention rates, and a data table for detailed metrics. Limit each chart to 5-7 colors for clarity.
Visual Hierarchy & Focus
MediumCreate a clear visual hierarchy by making the most important metrics larger and bolder. Use whitespace effectively to separate sections and highlight anomalies with conditional formatting based on performance.
Interaction & Feedback
LowImplement hover states for interactive elements to indicate selection. Provide loading skeletons during data updates and ensure visual feedback on filter selections for a smoother user experience.