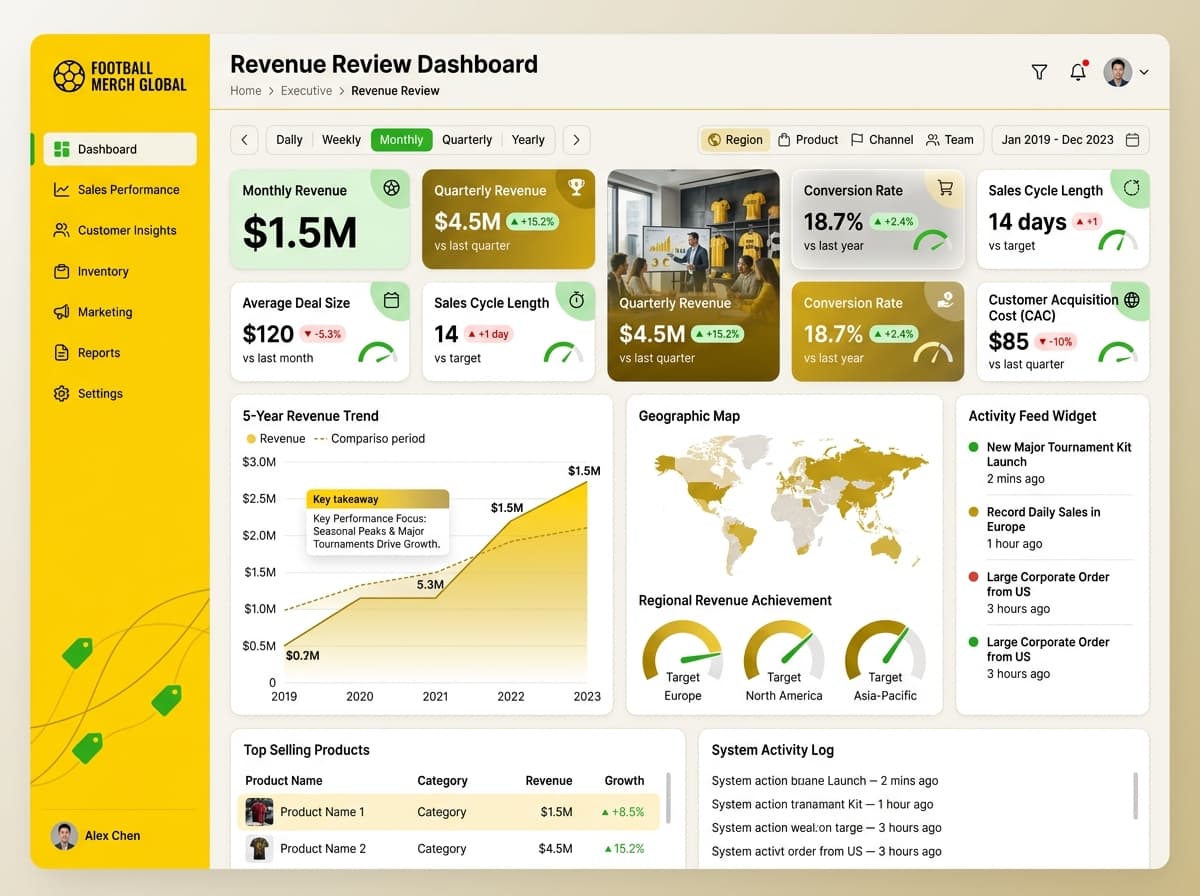
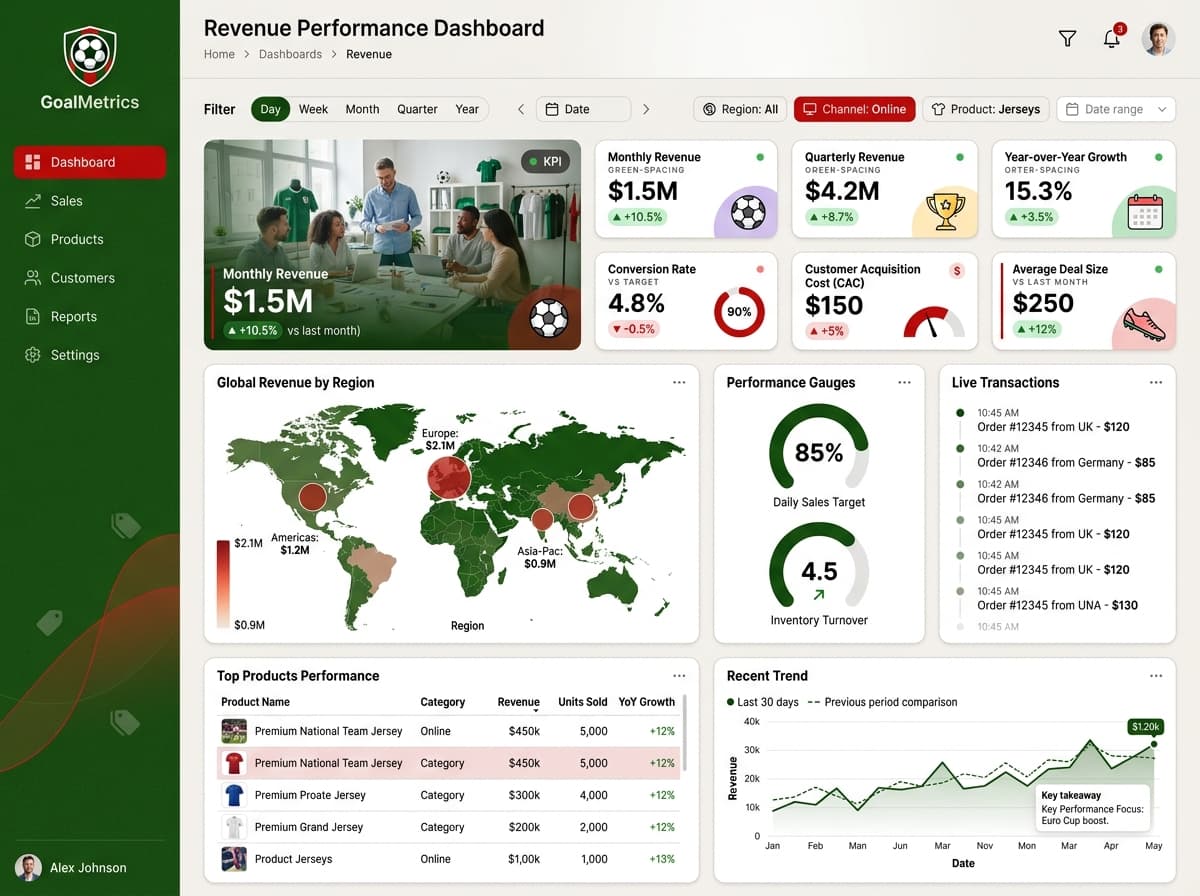
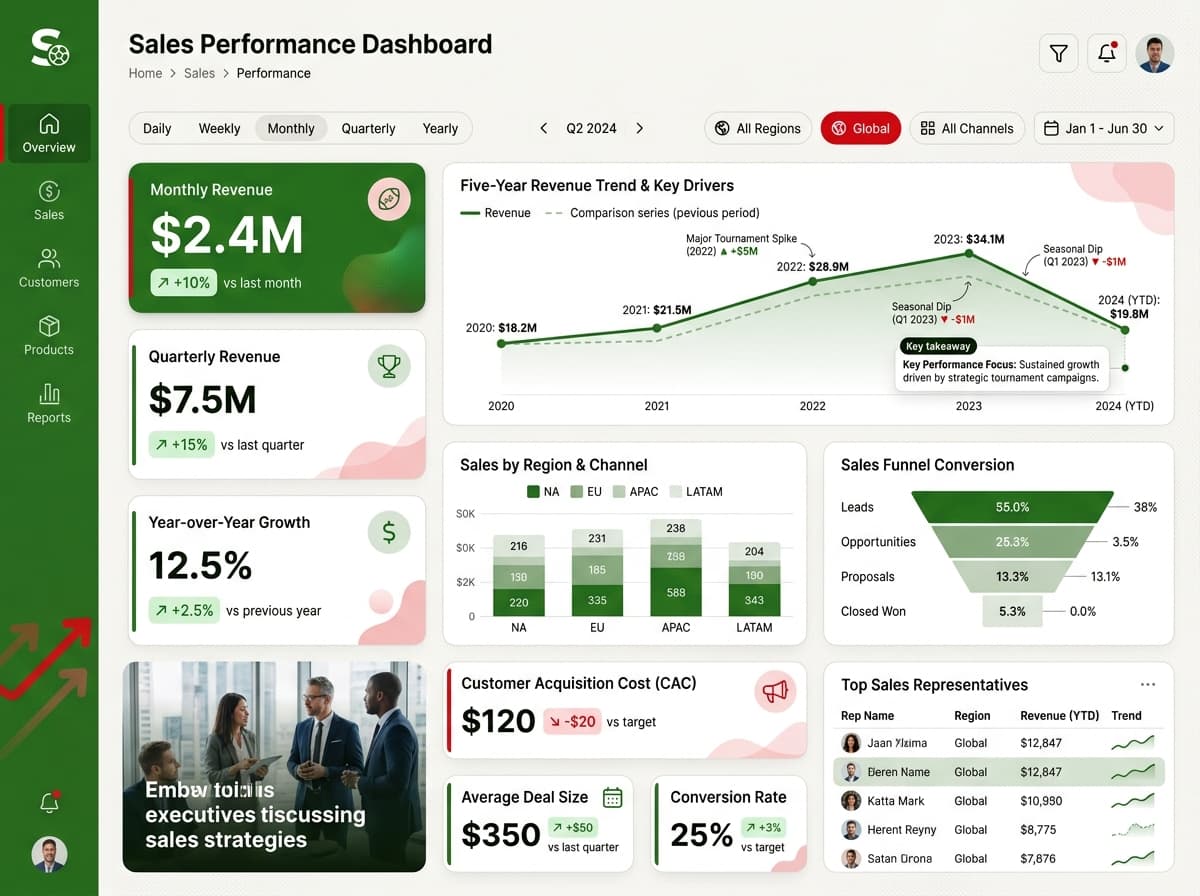
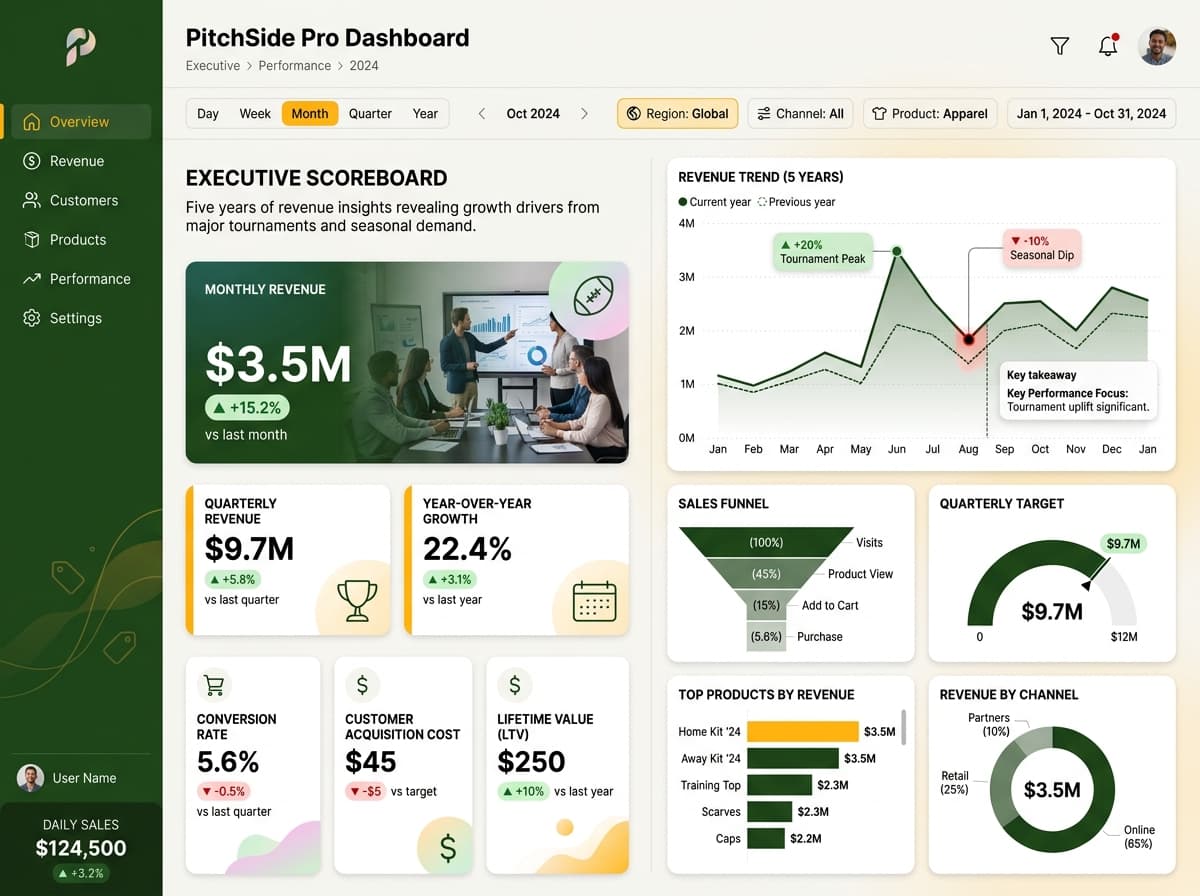
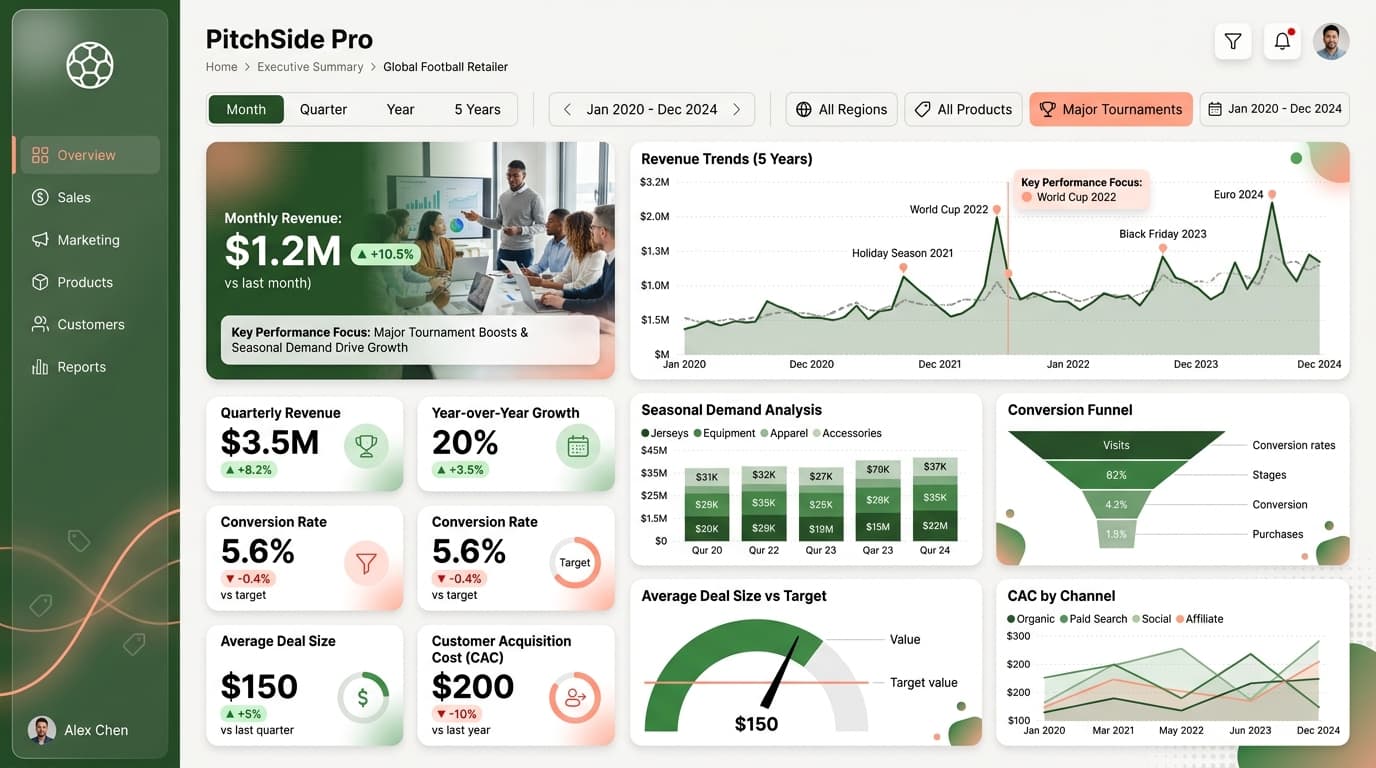
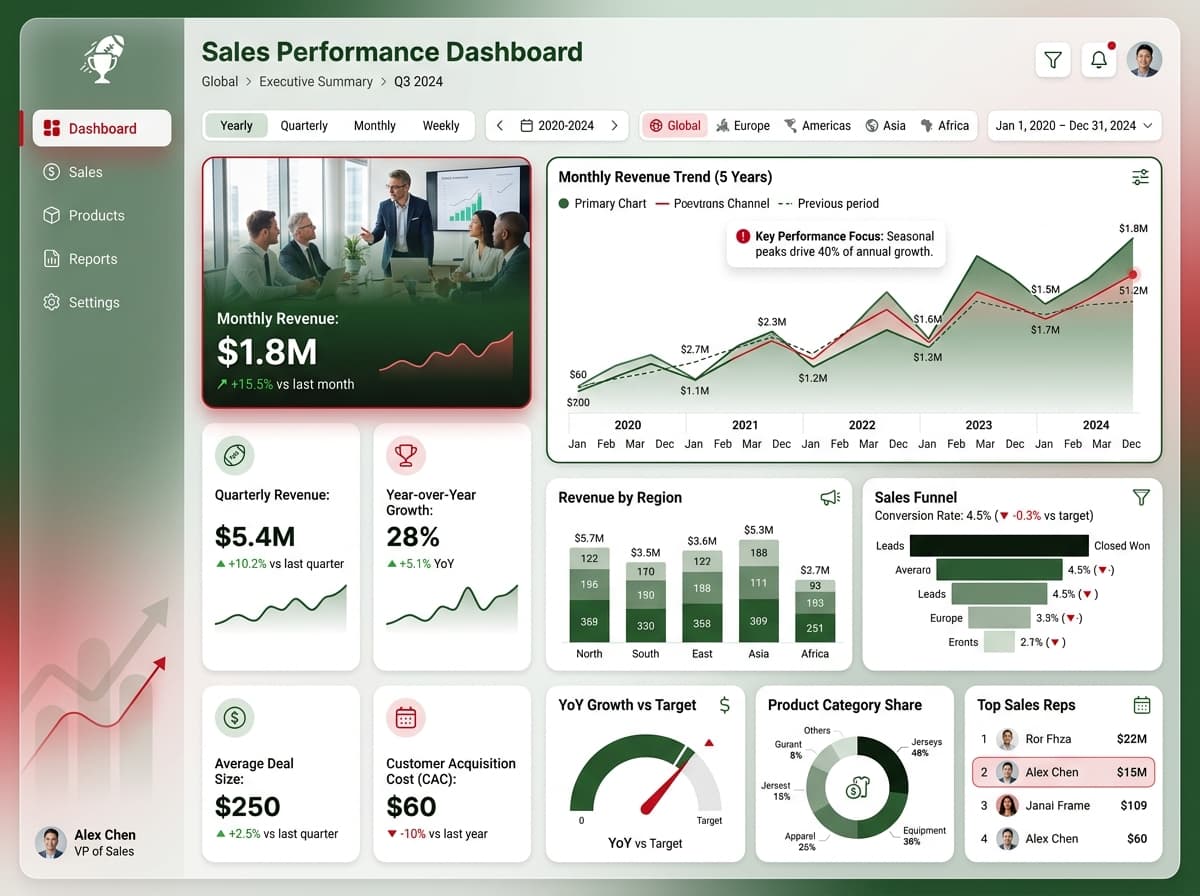
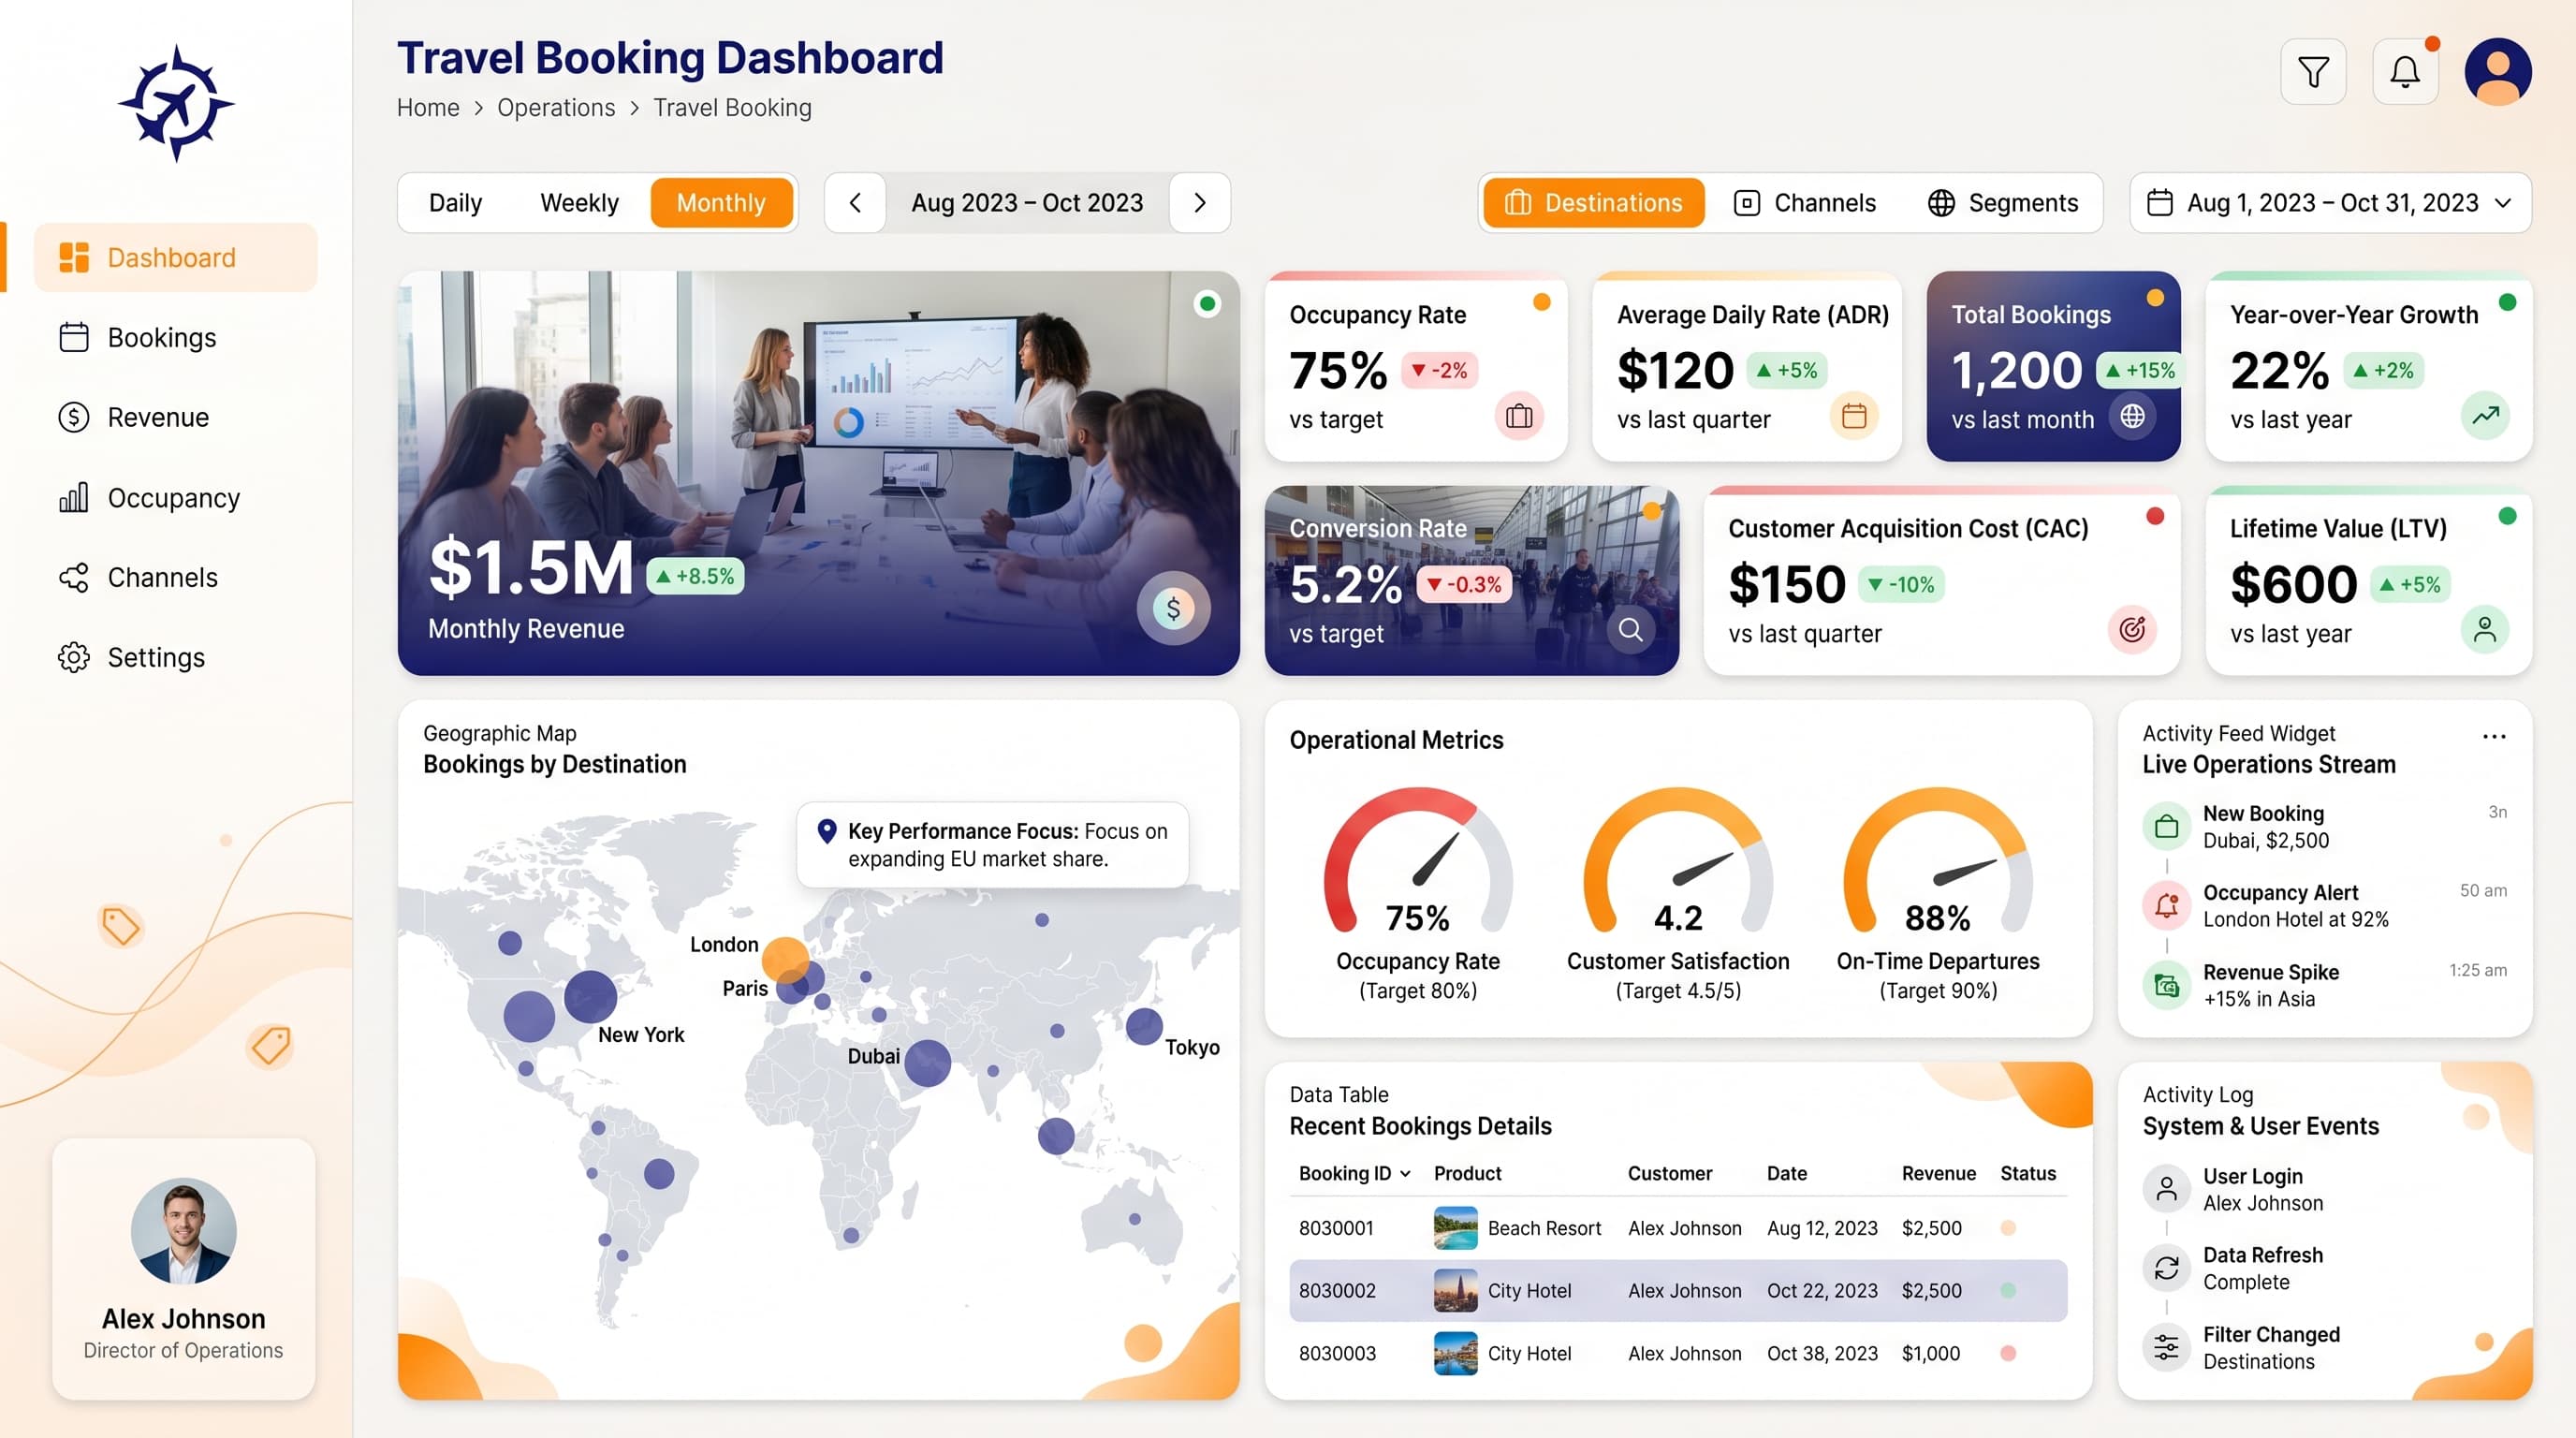
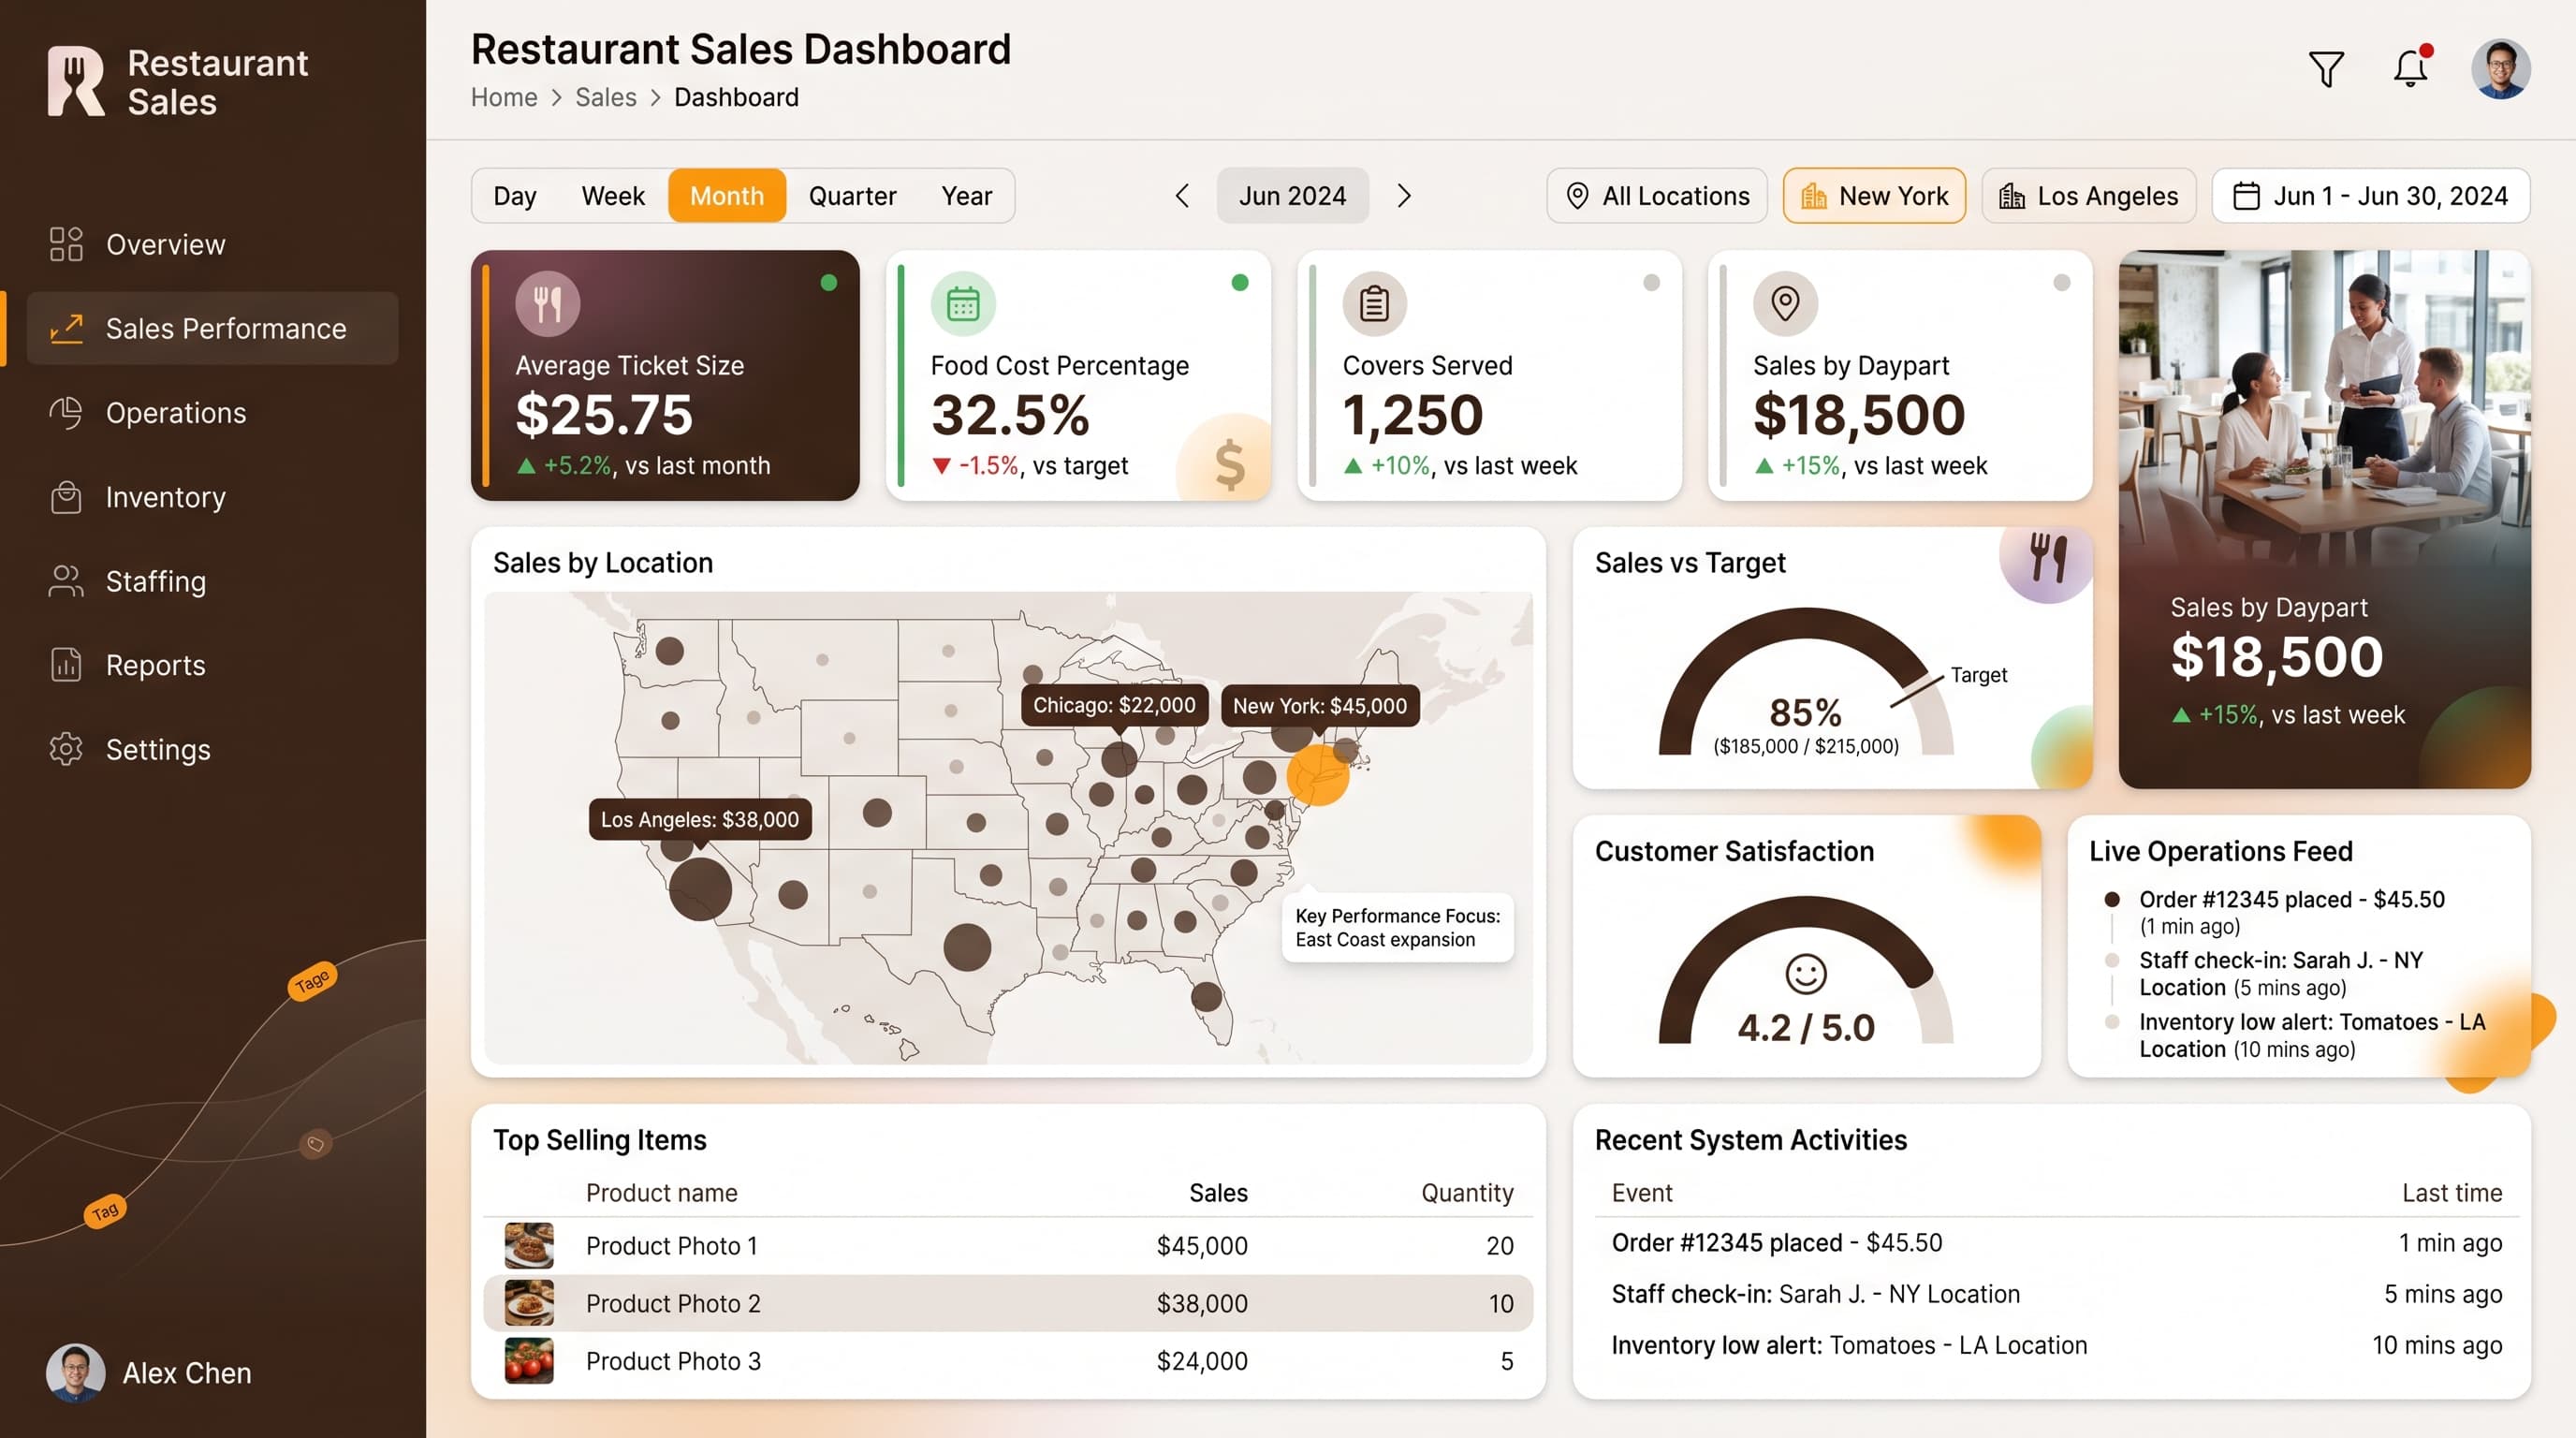
About this dashboard
Analyze monthly recurring revenue and churn rates to identify growth opportunities and enhance feature adoption.
KPIs tracked
Charts
Strategic insights
Design recommendations
Color Palette Strategy
HighUtilize the custom-E53E3E-505050 palette effectively to create a visually impactful dashboard. Ensure primary colors are used for headers and navigation, while secondary colors highlight key metrics. Maintain a contrast ratio of at least 4.5:1 for accessibility.
Layout & Grid System
HighImplement a 12-column grid to maintain a 16:9 ratio. Place KPIs at the top for visibility, charts in the middle for analysis, and filters on the sidebar. Ensure at least 16px padding and 20px gaps between cards.
Typography Hierarchy
MediumDashboard title should be set at 24-28px bold, section headers at 18-20px semibold, and body text at 12-14px regular. Maintain a consistent font family like Inter for a cohesive design.
Data Visualization UX
HighChoose Multi-Line Charts for trends, Stacked Bar Charts for comparisons, and Donut Charts for proportions. Limit colors to 5-7 per chart, and provide tooltips for additional context. Standardize axis formatting across charts.
Visual Hierarchy & Focus
MediumEstablish a clear visual hierarchy where the most critical metrics are the largest and boldest. Use whitespace effectively to separate sections and highlight anomalies using conditional formatting.
Interaction & Feedback
LowImplement hover states for interactive elements by adjusting opacity to 0.8. Provide visual feedback during data refresh and ensure drill-through navigation is available for detailed data exploration.