About this dashboard
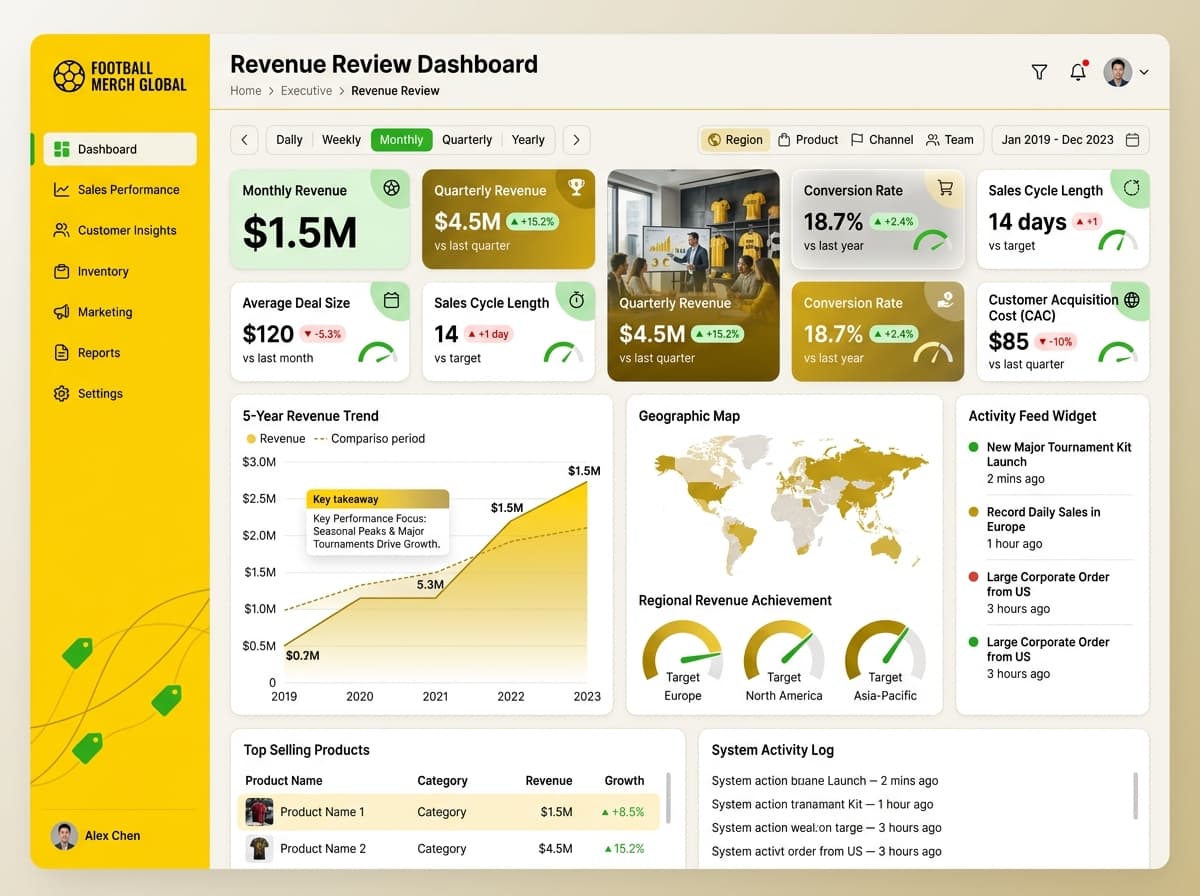
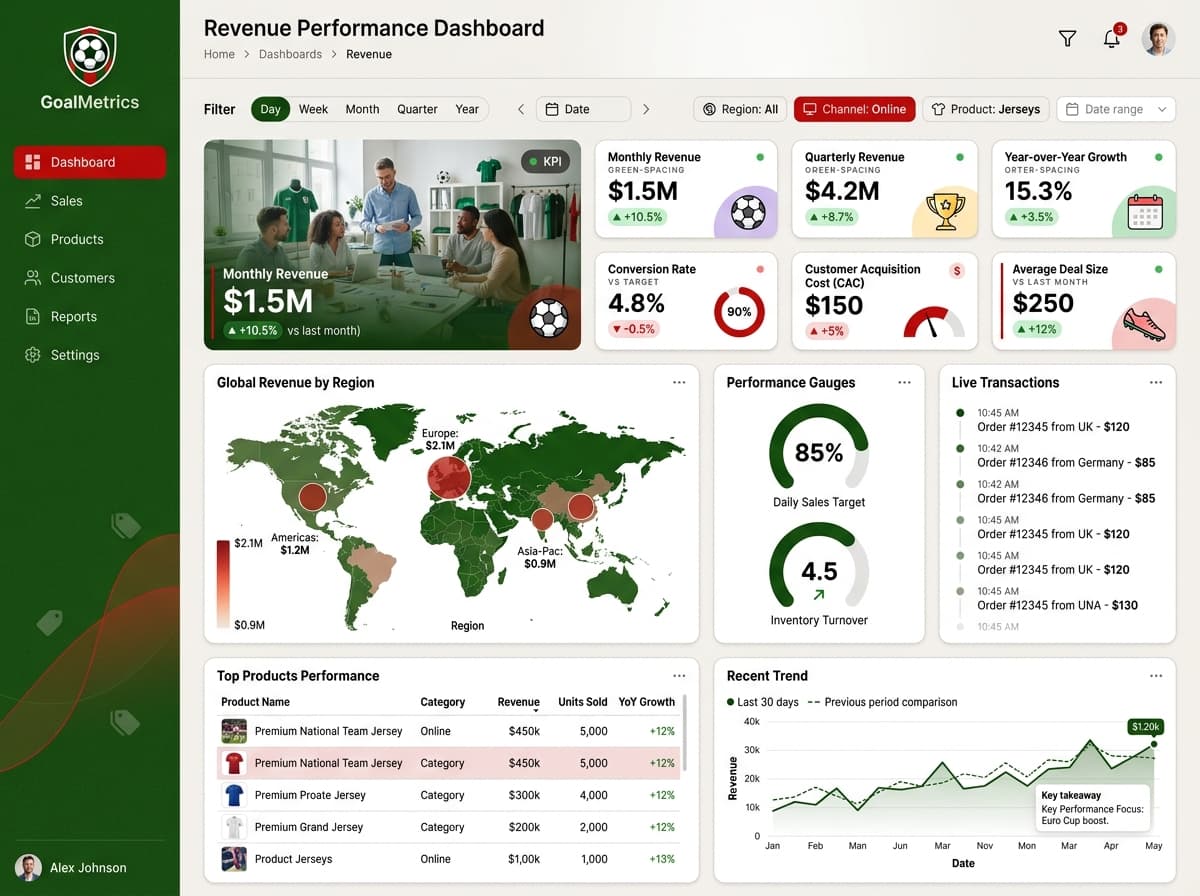
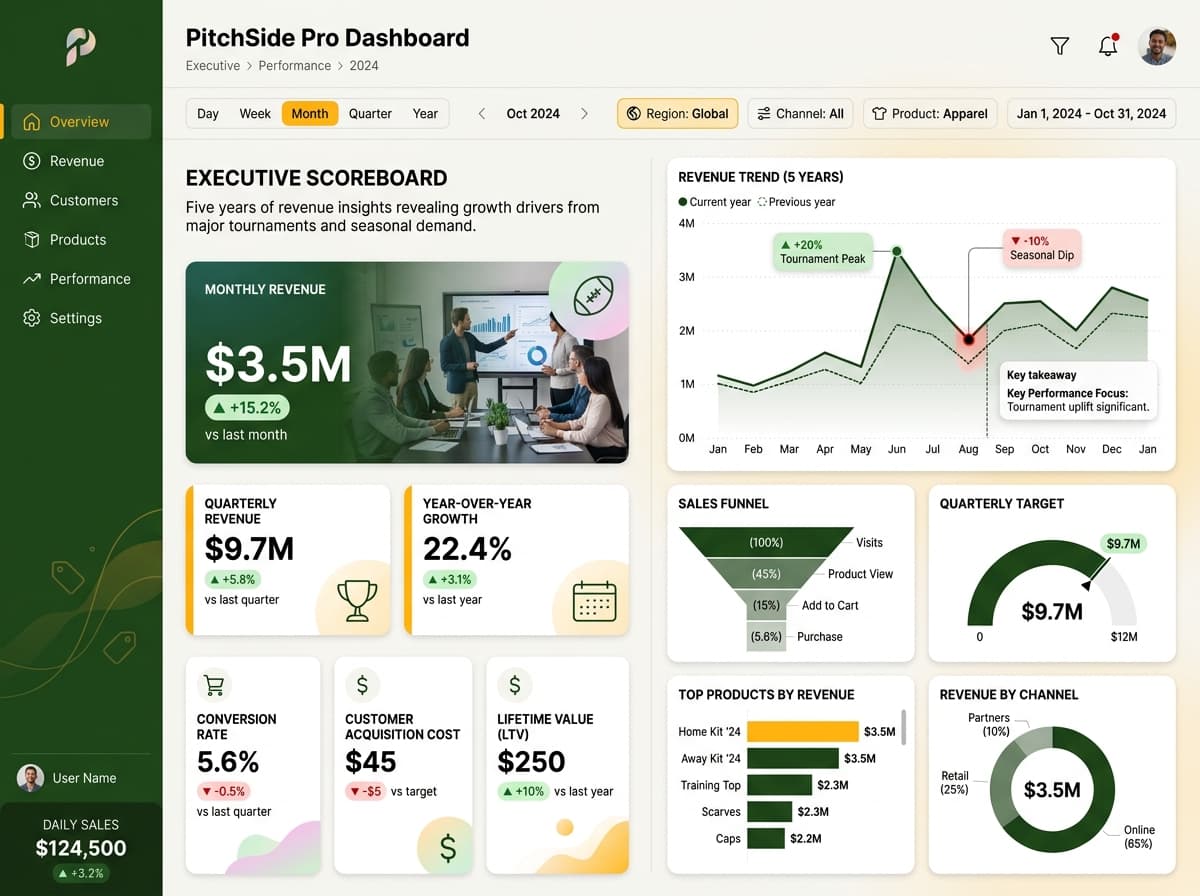
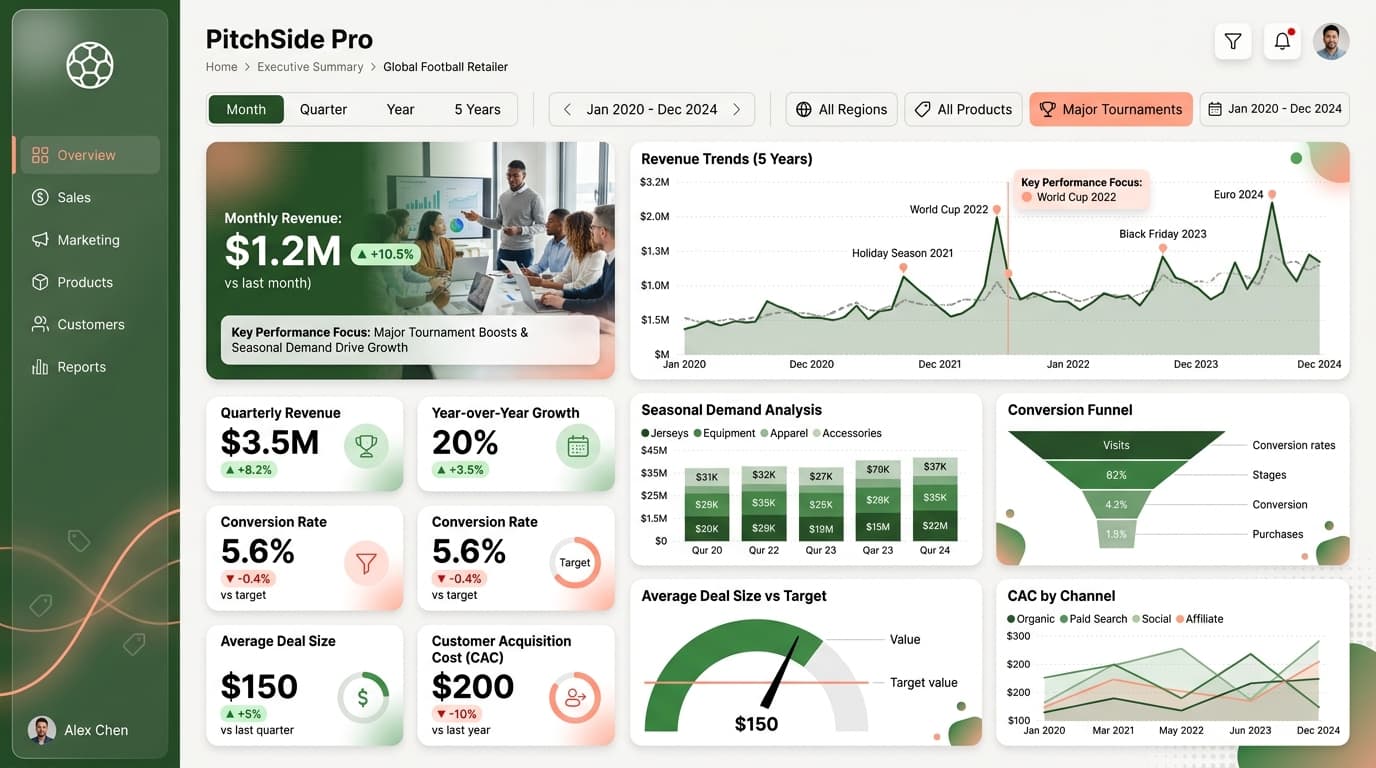
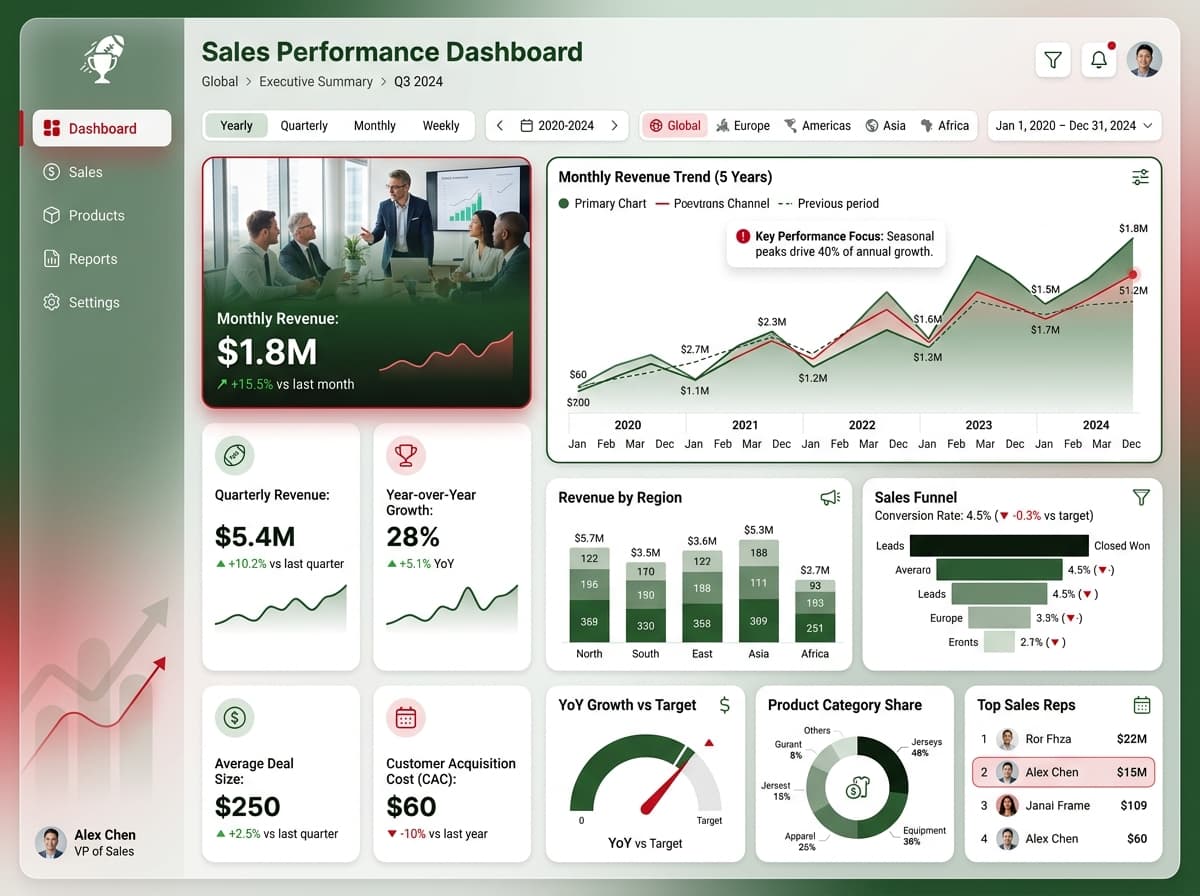
An executive scoreboard analyzing five years of revenue performance for a global football merchandise retailer.
KPIs tracked
Charts
Strategic insights
Design recommendations
Color Palette Strategy
HighImplement the custom-29771e-da061b color palette effectively. Use the primary color (#29771e) for headers, secondary color (#da061b) for key metrics, and ensure all text contrasts at a 4.5:1 ratio for accessibility.
Layout & Grid System
HighUtilize a 12-column grid for a 4:3 aspect ratio. Place KPIs at the top for visibility, charts in the middle for analysis, and filters on the sidebar. Maintain 16-20px gaps between sections for clarity.
Typography Hierarchy
MediumMaintain a clear typography hierarchy: Dashboard title at 24-28px bold, section headers at 18-20px semibold, card titles at 14-16px medium, and body text at 12-14px regular. Use a consistent font across the dashboard.
Data Visualization UX
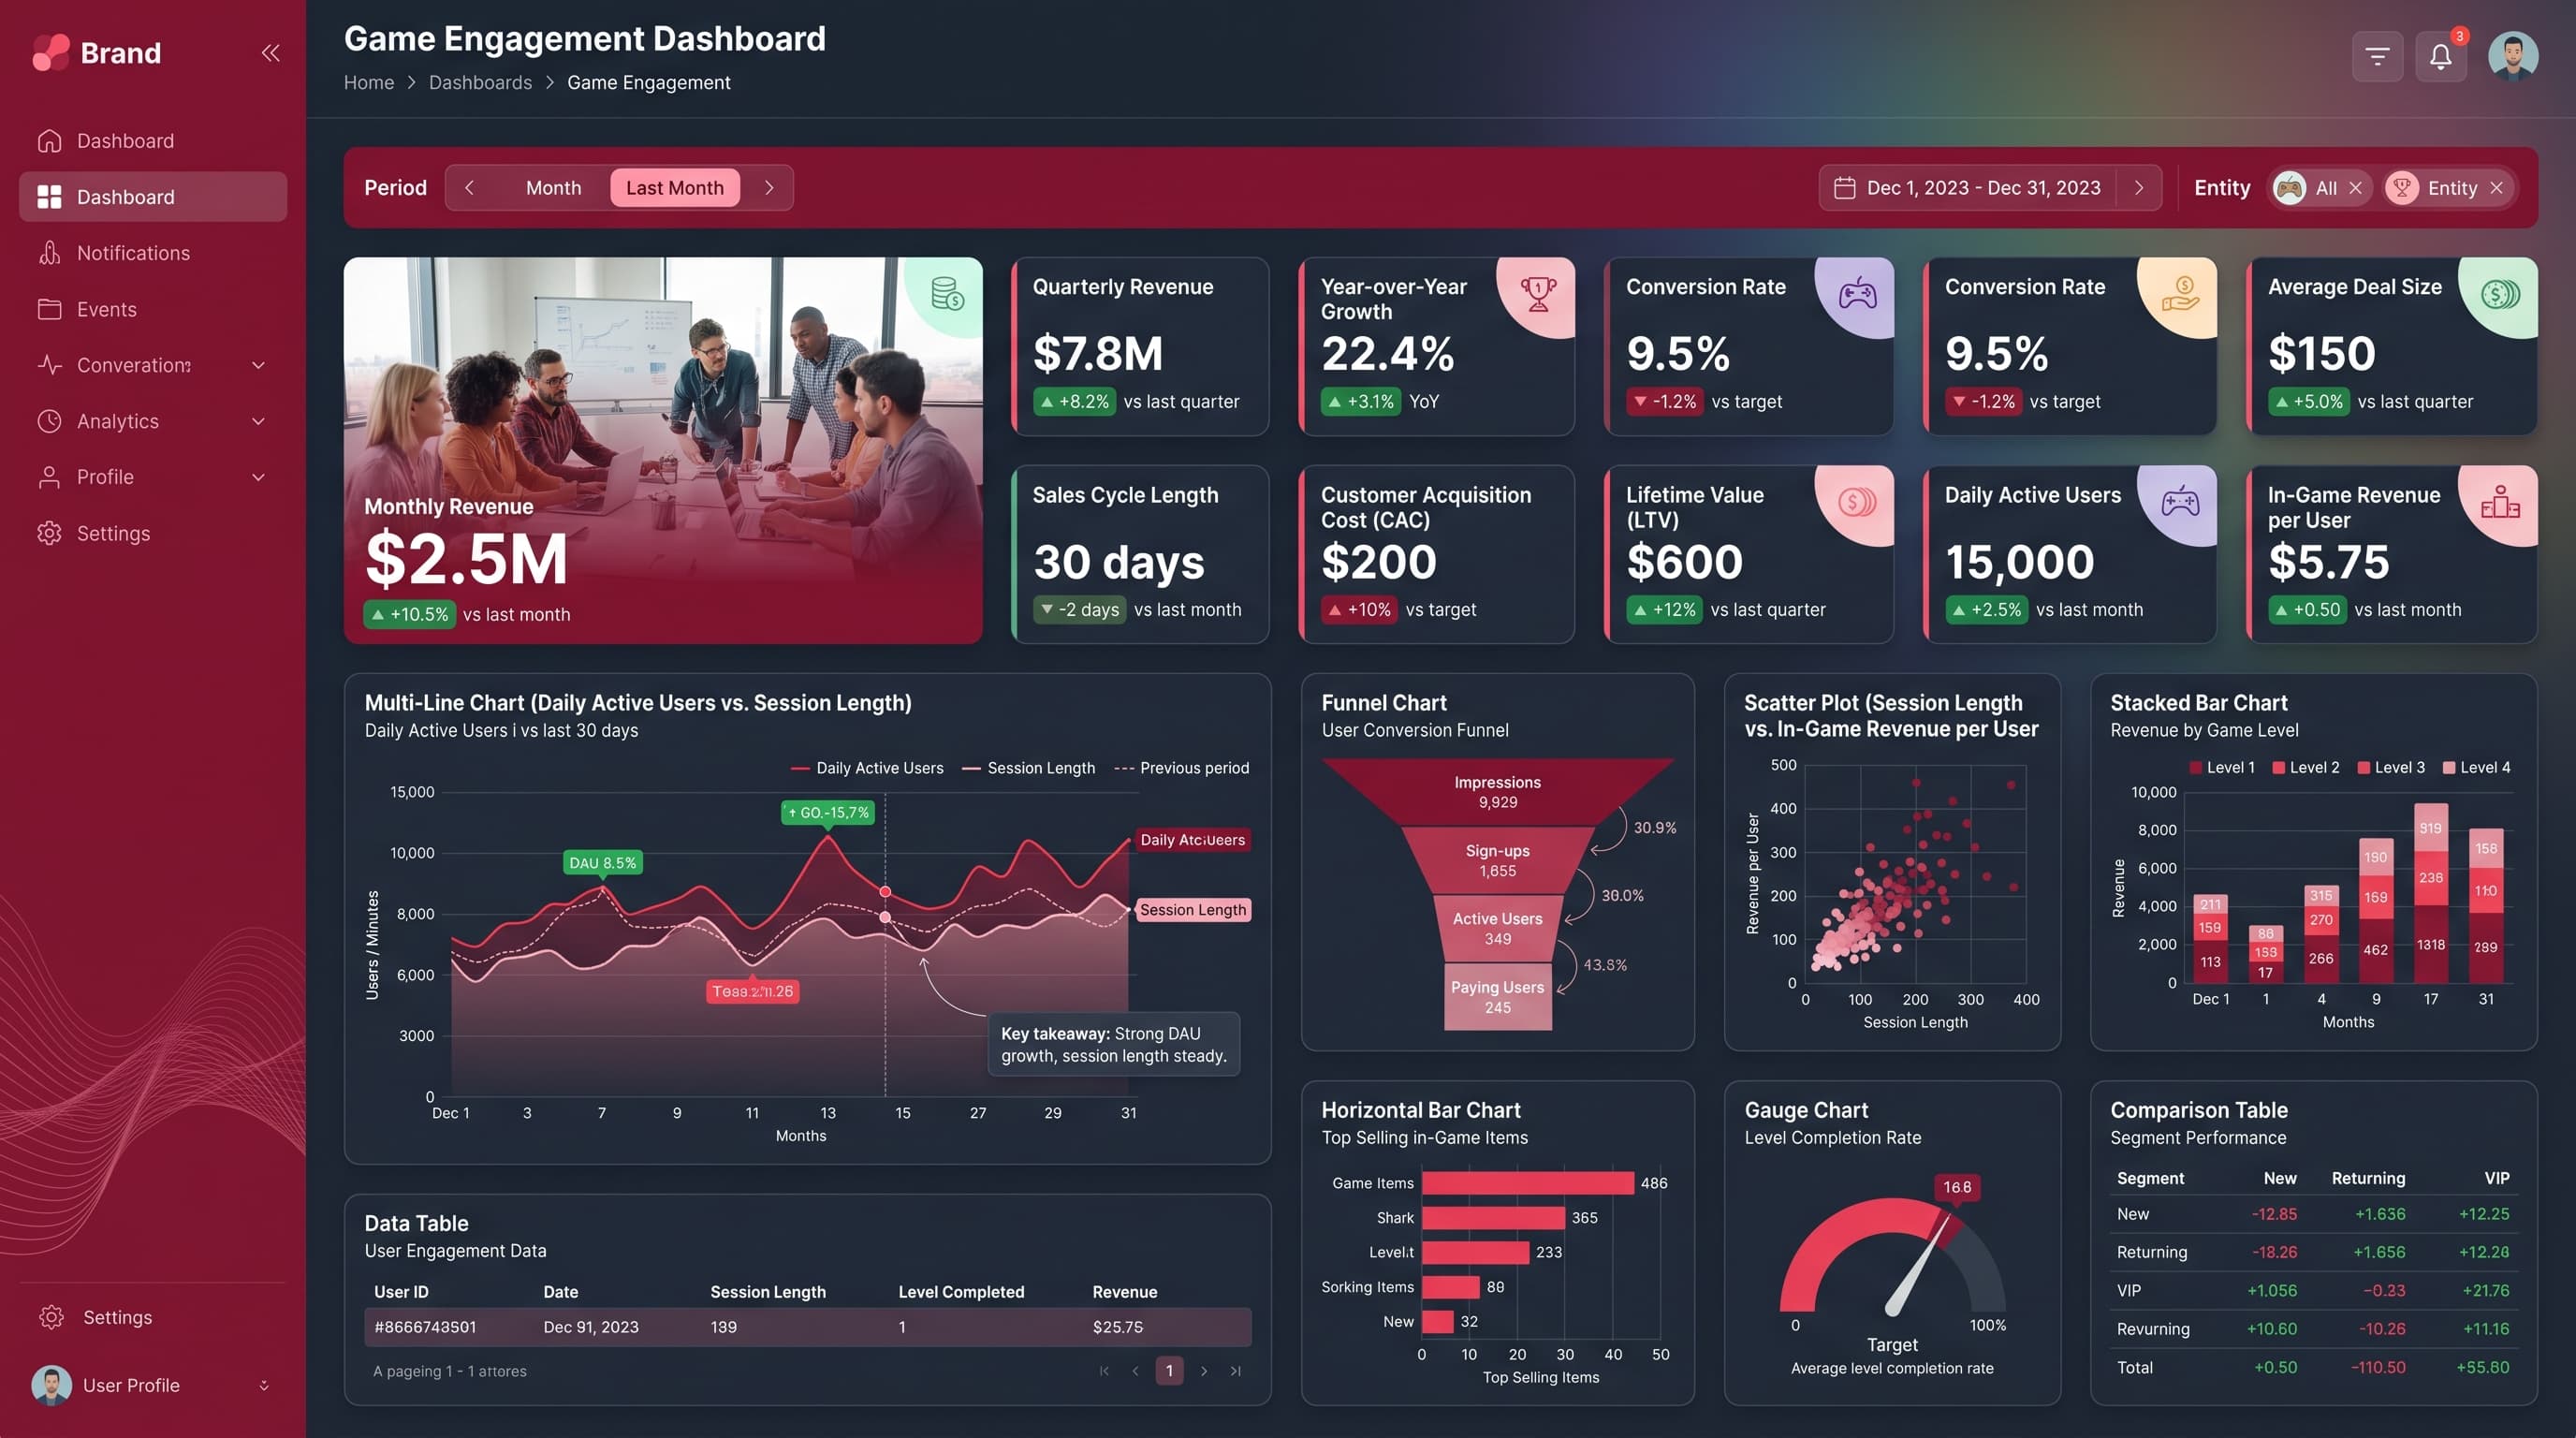
HighChoose chart types that best match the data narrative: Multi-Line for trends, Stacked Bar for comparisons, Funnel for conversion tracking. Limit colors to 5-7 per chart and ensure clear legends are outside the chart area.
Visual Hierarchy & Focus
MediumEstablish a clear visual hierarchy: use whitespace to separate sections, highlight important metrics, and utilize conditional formatting (e.g., red for negative changes, green for positive) to draw attention to anomalies.
Interaction & Feedback
LowIncorporate hover states for interactive elements to enhance user engagement. Implement loading states during data refresh to improve user experience, and consider drill-through navigation for detailed metric exploration.