

Field notes
Claude Dashboards and Power BI: explore in Claude, deliver in Power BI
Claude Dashboards answers data questions in a chat. Power BI runs governed reports. What each one does, how they fit, and how an agent bridges the two.
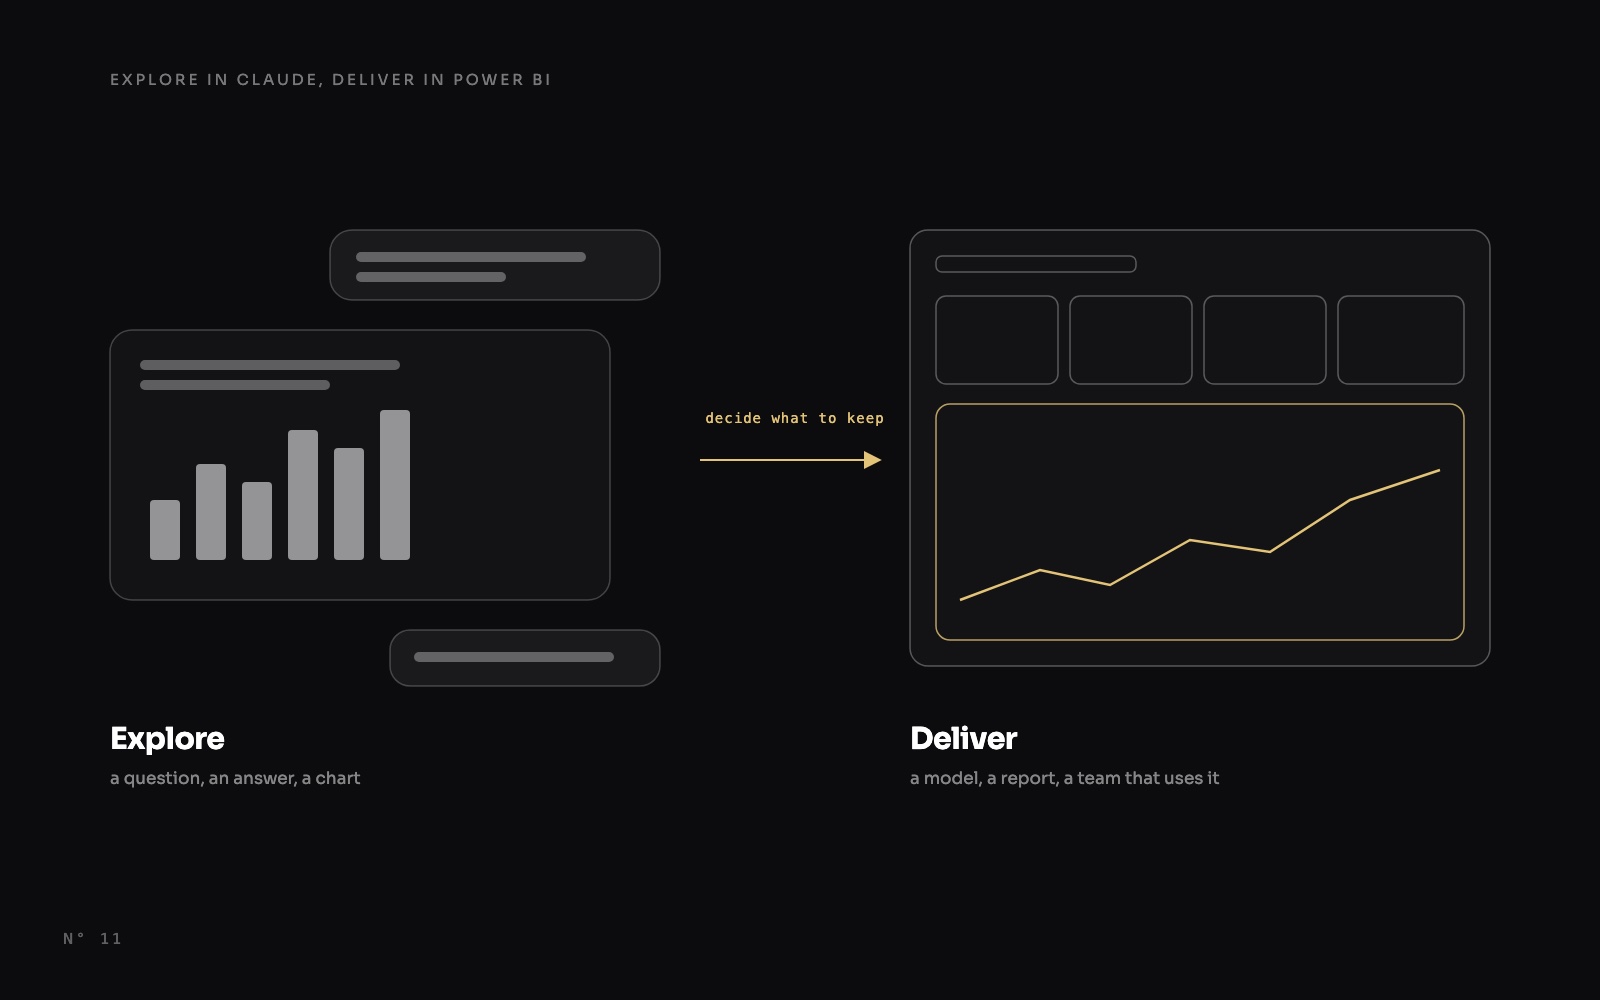
On 8 October 2026, Anthropic released Claude Dashboards in beta. You ask a question about company data, Claude writes the SQL, and a live dashboard appears in the conversation.
If your team already runs on Power BI, the useful question is not which one wins. It is where each one fits, and how something found in a conversation ends up in a report people can trust. This field note sticks to what both vendors document as of October 2026, with links to their own pages.
What Claude Dashboards does
From Anthropic's launch post and its help center:
- It starts from a question. You ask in any chat, or pick a Dashboards template in the Artifacts tab. Claude "pulls answers from your data, builds the dashboard, and keeps it current as the data changes."
- It reads your data platform. Anthropic names Amazon Redshift, BigQuery, ClickHouse, Databricks and Snowflake, plus your other connectors, with Salesforce as the example.
- Every chart shows its work. Claude writes a SQL query for each chart and runs it against your data source. Each chart shows its query and when its data was last refreshed.
- It lives in Artifacts. A dashboard starts private and you share it from the dashboard. Anthropic adds that dashboards can be shared outside your organization "if your admin allows it."
- It is a beta on paid plans: Pro, Max, Team and Enterprise. On Enterprise it stays off until an owner turns it on in Organization settings > Artifacts, and owners can restrict it to groups with custom roles.
Anthropic is clear about the scope. "Dashboards work well for quick, exploratory questions," and they "work alongside your BI and analytics tools." For deeper analysis, you send the dashboard to another tool: Amplitude, Grafana, Hex, Mixpanel, Omni, Perplexity, PostHog or Sigma today, with Looker, monday.com and Tableau coming soon. Power BI is on neither list.
That scope is the strength. The distance between a question and a chart shrinks to a sentence, you iterate by asking again, and the SQL is right there to check. For the questions that never reach the top of a BI backlog, that is a real change.
What Power BI keeps
Power BI solves a different problem: the same numbers, for everyone, every day, under control. Teams keep it for:
- A semantic model. Tables, relationships and DAX measures, defined once and read by every report. Microsoft describes a semantic model as "a source of data that's ready for reporting and visualization."
- Row-level security. RLS filters rows through roles, so a regional manager sees their region in the same report as everyone else.
- Refresh. Scheduled refresh in the Power BI Service, through a gateway for on-premises sources.
- Distribution. Workspace apps for large audiences, and reports in Microsoft Teams channels and chats.
- The reports people already read. The ones on the Monday agenda, with the definitions everyone has agreed on.
It has also become agent-ready. Microsoft's September 2026 feature summary made Power BI Projects (PBIP) generally available, and "PBIR is now the default report format for PBIX and PBIP files." A report is now a folder of JSON files that an agent can read, change and diff in Git (PBIP, PBIR and TMDL explained). At FabCon Europe, Microsoft also announced a natural-language app building experience for Power BI Desktop, due "in the coming months."
And Power BI reads the same warehouses, with connectors for Snowflake, BigQuery, Databricks and Amazon Redshift.
| Claude Dashboards | Power BI | |
|---|---|---|
| Starts from | A question in a chat | A semantic model |
| Logic lives in | One SQL query per chart | Measures and relationships in the model |
| Freshness | Each chart shows its last refresh | Scheduled refresh in the Service |
| Access | Private, then shared from the dashboard | Workspaces, RLS roles, apps |
| Built for | "Quick, exploratory questions" | Reports a whole organization reads |
How they fit: explore in Claude, deliver in Power BI
The two tools meet at one point: a decision about what to keep. As of October 2026, Power BI is not among the tools Anthropic lists for sending a dashboard, so what crosses over is not a file. It is the definitions: which metric, which filter, which grain.
- Explore in the conversation. Ask, refine, read the SQL behind each chart. Most dashboards end here, and that is fine.
- Decide what to keep. A chart that comes back every week deserves a home. Write its definition in plain words and keep its SQL as the spec.
- Define it once, in the semantic model. The SQL becomes a DAX measure and, if needed, a relationship. Microsoft's Power BI Authoring MCP server lets an agent create and change tables, columns, measures, relationships and security roles, locally (generally available) or hosted (preview).
- Build the report in PBIR. Microsoft's Report Authoring skill, in preview, edits pages, visuals, filters, formatting and themes in PBIR files, and its docs list Claude Code among the compatible agents.
- Validate, then look. Microsoft's validator checks the structure, never the render: we listed seven things it lets through in The PBIR validator passes, Desktop disagrees. The Desktop Bridge lets an agent reload Power BI Desktop and capture each page as a PNG to check its own work. We run that loop from a Mac, with Desktop in a virtual machine: the setup is in an agent loop on Power BI Desktop from a Mac.
- Publish. The report goes to the Service, RLS roles get their members, and the app or the Teams tab does the rest.
When an agent does steps 3 to 5, it is an agent working on files, such as Claude Code, not the dashboard in the chat. Microsoft's own advice applies: work in PBIP under Git, so every change is a diff you review, and remember that "model metadata and query results flow into the conversation," to whichever LLM provider your client uses.
The bridge also runs the other way. The Fabric IQ MCP server, generally available since September 2026 according to the Fabric feature summary, lets MCP-compatible clients discover Power BI reports and semantic models and run DAX against authorized models, with row-level and object-level security still enforced by Fabric.
Where design fits
Microsoft's agent tooling now spans the model, the report files and the render check. Its Report Design skill, also in preview, produces a design brief: an archetype per page, a layout variant, chart choices, a colour map and a theme. It does not write PBIR files itself; it hands the brief to the authoring skill. And Copilot in Power BI creates pages and adds or changes visuals, but "doesn't support styling or formatting changes."
A theme and a brief get you a clean report. A designed report takes more. When we took Colis Pro apart, only 9 of its 347 visuals were charts: the look lives in background images and in the cards laid over them, as we show in the anatomy of a designed Power BI report. Getting it right took 77 rounds of comparing the files with what Desktop drew. In our experience, that finish is still where most of the hours go.
That is the layer we work on. ChartCraft forges designed Power BI projects (.pbip, with a PBIR report and a TMDL model): layouts, palettes, KPI cards, charts and slicers. People use the Forge screen. Agents use our MCP server from Claude Code, Cursor, VS Code or any MCP client, and can bind the report to their own semantic model by sending table, column and measure names, never data or DAX. From Claude, that means Claude Code or Claude Desktop for now: claude.ai custom connectors require OAuth, which our server does not offer yet. Colis Pro, a free report we built with an agent, shows the finish we aim for.
If your team just got Claude Dashboards
- Turn it on deliberately. On Enterprise, owners enable it in Organization settings > Artifacts and can limit it to groups with custom roles. Start with the analysts who own your semantic models.
- Point it at the warehouse your models read. A gap between a dashboard and a report then becomes a definition to reconcile, not a mystery. Compare the chart's SQL with the measure's DAX before you trust either.
- Promote what recurs. A question asked three Mondays in a row is a measure and a visual waiting to be built.
- Keep sensitive figures in Power BI. RLS, refresh and distribution stay where they are. A shared dashboard is not a governed report, so decide who may share what before the first link goes out.
- Make your Power BI estate agent-ready. Save reports as PBIP (PBIR is now the default), put them in Git, and let an agent do the promotion as a diff you review.
FAQ
Does Claude Dashboards replace Power BI?
Anthropic positions it for "quick, exploratory questions" and says dashboards "work alongside your BI and analytics tools." Power BI keeps the semantic model, RLS, refresh and distribution.
Can I send a Claude dashboard to Power BI?
Not as of October 2026. Anthropic lists Amplitude, Grafana, Hex, Mixpanel, Omni, Perplexity, PostHog and Sigma, with Looker, monday.com and Tableau coming soon. Rebuild what you keep as measures in your model.
Can Claude write a Power BI report?
Anthropic does not list Power BI among a dashboard's destinations, but a coding agent such as Claude Code can edit PBIP projects, and Microsoft lists Claude Code among the agents its Power BI authoring skills support.