

PBIR & agents
PBIP, PBIR and TMDL explained: inside a Power BI project
What is inside a Power BI project folder, file by file, from a real 347-visual report: PBIR for the report, TMDL for the model, and why Git and agents care.
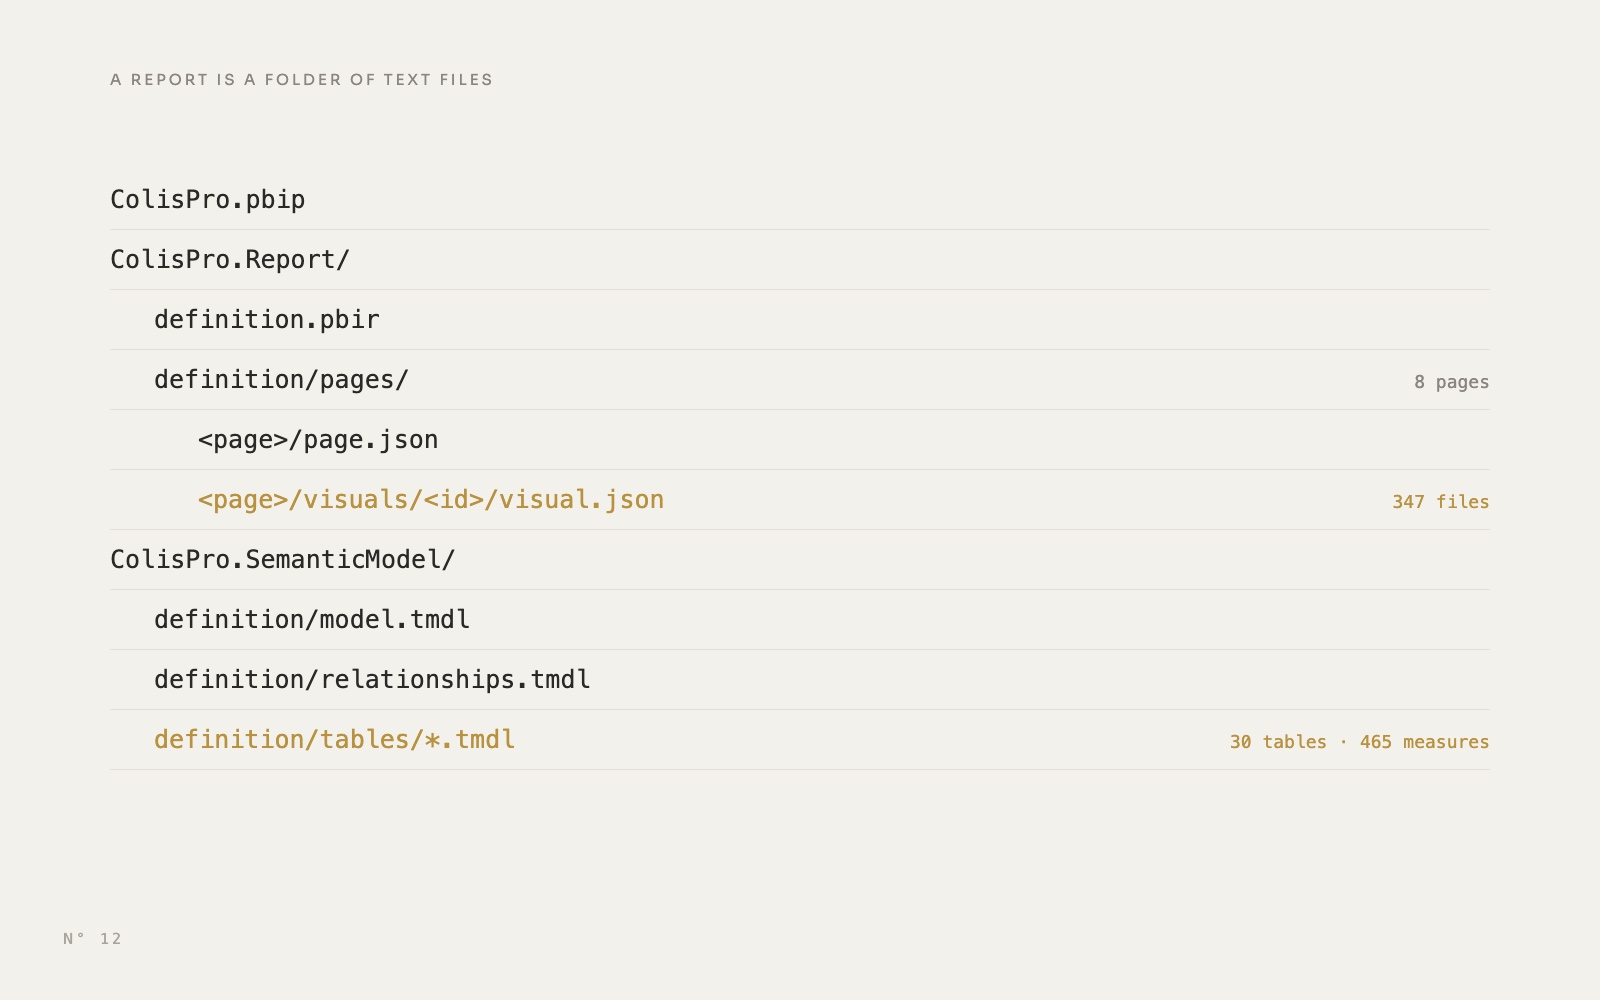
A .pbix file is a black box. Change one colour, save, and Git records that a binary file changed. Nobody can tell what moved, and two people who edit the same report cannot merge their work.
A Power BI project (PBIP) saves the same report as a folder of text files: one file per page, one per visual, one per table. Microsoft now documents PBIP and PBIR as generally available, and since the September 2026 rollout PBIR is the default report format in Power BI Desktop and the Service.
This article opens a real one, file by file: Colis Pro, a free Power BI report built with an AI agent: 347 visuals on 8 pages (three of them hidden), 30 tables and 465 measures.
PBIX and PBIP in one picture
Three names, three layers:
- PBIP is the project: a folder, with a small
.pbipfile that points to the report. - PBIR is the format of the report inside it: a
definitionfolder of JSON files. - TMDL, the Tabular Model Definition Language, is the format of the semantic model: a
definitionfolder of.tmdltext files.
PBIX is not going away: the general availability announcement (message center MC1465770, 1 September 2026) says so explicitly. Reports in the older PBIR-Legacy format, one big report.json, still open, and Power BI converts them to PBIR when you edit and save them.
The tree of a real project
| File | What it holds in Colis Pro |
|---|---|
ColisPro.pbip | A pointer to ColisPro.Report, plus one setting, enableAutoRecovery |
definition.pbir | The model the report uses: byPath to ../ColisPro.SemanticModel |
definition/report.json | Base theme CY26SU05, custom theme ColisPro.json, the list of registered images |
pages/pages.json | The order of the 8 pages and the landing page |
page.json | One per page: 1440 × 1080, background image, visual interactions |
visual.json | One per visual, 347 in all |
bookmarks/ | 5 bookmarks, one per main page |
StaticResources/ | 13 PNG and 24 SVG images, 2 themes |
.platform | Item type, display name and logicalId, for Fabric Git integration |
definition.pbism | The model's format version, 4.2 |
database.tmdl, model.tmdl | Compatibility level 1606, culture fr-FR, a ref table line per table that fixes their order |
tables/*.tmdl | 30 files, one per table: columns, measures, partitions |
relationships.tmdl | 18 relationships, 6 of them inactive |
expressions.tmdl | DossierDonnees, the Power Query parameter that holds the data folder path |
cultures/fr-FR.tmdl | Q&A linguistic metadata, 1.3 MB of it |
diagramLayout.json | The model diagram. Leave it to Desktop: Microsoft does not support editing it outside Desktop |
PBIR: one folder per page, one per visual
In PBIR, the report is a tree, not a file. pages.json lists the pages in order. Each page folder holds a page.json and a visuals folder, and each visual folder holds a visual.json. The Colis Pro Overview alone has 72 visual folders.
Here is the card that counts saturated pickup points on the Network page, trimmed to the four parts that matter and condensed. Desktop writes one key per line, so the full file runs to 643 lines, most of them formatting.
{
  "$schema": "https://developer.microsoft.com/json-schemas/fabric/item/report/definition/visualContainer/2.13.0/schema.json",
  "name": "9c9200b29ce35634a557",
  "position": { "x": 691, "y": 902, "z": 33000, "height": 100, "width": 180, "tabOrder": 33000 },
  "visual": {
    "visualType": "cardVisual",
    "query": {
      "queryState": {
        "Data": {
          "projections": [{
            "field": {
              "Measure": {
                "Expression": { "SourceRef": { "Entity": "_Mesures" } },
                "Property": "Points saturés"
              }
            },
            "queryRef": "_Mesures.Points saturés",
            "nativeQueryRef": "Points saturés",
            "displayName": "Points saturés"
          }]
        }
      }
    },
    "objects": {
      "value": [{
        "properties": {
          "fontSize":  { "expr": { "Literal": { "Value": "28D" } } },
          "fontColor": { "solid": { "color": { "expr": { "Literal": { "Value": "'#FFFFFF'" } } } } }
        },
        "selector": { "id": "default" }
      }]
    }
  }
}positionplaces the visual on the page in pixels, withzfor stacking andtabOrderfor keyboard order.visualTypenames the visual.cardVisualis the new card: 167 of the 347 Colis Pro visuals are cards.querybinds the fields. This card reads one measure,Points saturés, from the_Mesurestable. That name is the link to the model.objectsholds the formatting. Numbers carry a type suffix (28D), text sits in single quotes. The container (title, background, border) is formatted next to it, invisualContainerObjects.
Where each formatting property has to sit is a subject of its own, covered in the PBIR validator traps.
TMDL: one file per table
The model side reads like an indented outline. Each table file declares the table, then its columns, measures and partitions. Here is DimRegion.tmdl, trimmed to one column and its partition:
table DimRegion
    lineageTag: bf19eef9-f1b0-5f2f-9594-3cf40a2fa46b

    column Region
        dataType: string
        lineageTag: 27ae4132-0ea3-59bd-a331-fa27b8f88533
        dataCategory: StateOrProvince
        summarizeBy: none
        sourceColumn: Region
        sortByColumn: Ordre

    partition DimRegion = m
        mode: import
        source =
                let
                    Source = Parquet.Document(File.Contents(DossierDonnees & "DimRegion.parquet")),
Properties are written name: value, a bare isHidden means true, and indentation decides what belongs to what (the files use one tab per level). Expressions follow an =: M for a partition, DAX for a measure. 18 of the 30 Colis Pro partitions are Power Query, 13 of them reading Parquet files. The other 12 are calculated tables, like the thresholds of our settings panel.
All 465 measures sit in a single table file, _Mesures.tmdl (3,919 lines), sorted into 17 display folders. This is the measure behind the card above:
    measure 'Points saturés' = COUNTROWS ( FILTER ( VALUES ( DimPointDepot[PointID] ), [Occupation] >= [Seuil saturation] ) )
        formatString: #,0
        displayFolder: 40 Réseau
        lineageTag: 1a1db087-26dd-5beb-97f2-1c029674def2
formatString and displayFolder are the format and the display folder you set in Desktop's Properties pane. lineageTag is an identifier that Desktop generates.
What stays out of the folder you share
Two kinds of file live in .pbi subfolders and belong to your machine only:
.pbi/cache.abf, in the model folder: a backup of the model with its data, as it was when last edited. In our working copy of Colis Pro, it weighs 142 MB..pbi/localSettings.json, in both folders: settings for the current user and computer.
When you save as a project, Desktop writes a .gitignore that excludes exactly these two, unless one already exists in the folder or in the parent Git repository:
**/.pbi/localSettings.json
**/.pbi/cache.abf
Without the cache, Desktop opens the model with its full definition and no data. That is why the Colis Pro download has no cache.abf and asks you to click Refresh first: the data loads from the Parquet files that ship with it.
Not everything under .pbi is private: editorSettings.json is meant to be shared, and Colis Pro commits it. And one leak is easy to miss: Microsoft warns that visual.json and bookmark files can store values from your data, such as a filter value or a slicer selection. Read the diff before you push to a public repository.
Why it matters
Readable diffs. Here is a real change from Colis Pro, between two snapshots of the shipments line chart on the Overview. Its axis moved from the short month name to a one-letter initial:
-        "Property": "MoisCourt"
+        "Property": "Initiale"
       }
     },
-    "queryRef": "AxeMois.MoisCourt",
-    "nativeQueryRef": "MoisCourt",
+    "queryRef": "AxeMois.Initiale",
+    "nativeQueryRef": "Initiale",
In a .pbix, the same change is an opaque blob. Here, the folder name says which visual changed and the lines say which field.
Scripts. A batch change becomes a loop over files. Microsoft's own example is hiding the visual-level filters on every visual of a report.
AI agents. An agent reads text and writes text. It reads the TMDL to learn the tables, columns and measures, then writes visual.json files that bind them. Colis Pro was built that way.
Validation and render checks. Microsoft's offline validator, powerbi-report-author validate, checks the files against their schemas in seconds. It never draws anything, which is why it can pass while Desktop disagrees. The truth is the render: we have the agent drive Power BI Desktop and capture what it draws, a loop described in our Desktop Bridge article.
Fabric Git integration speaks the same formats. Connect a workspace to a Git repository and Fabric exports its reports as PBIR, with a .platform file per item. It writes no .pbip: open definition.pbir in the report folder instead.
Save a .pbix as a project
- Open the
.pbixin Power BI Desktop. - Go to File > Save as and pick a short local folder. Desktop cannot save a project directly to OneDrive or SharePoint.
- In the file type list, choose the Power BI project type (
.pbip), then save. - Desktop writes
<name>.pbip,<name>.Report,<name>.SemanticModeland the.gitignore. The title bar now shows that you are working on a project. - Run
git initand commit. Desktop writes CRLF line endings, so turn on Git'sautocrlfsetting to keep diffs clean.
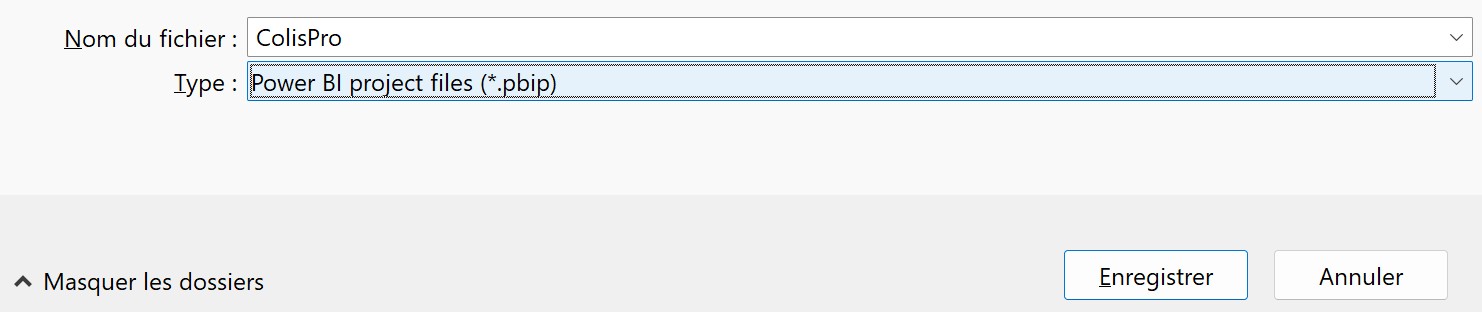
The way back is the same menu: open the .pbip and save it as a .pbix. There is no command-line converter: Microsoft documents File > Save as as the only way, in both directions.
If Save as does not offer the project type, look under File > Options and settings > Options > Preview features. On the Desktop build we used in October 2026, the Power BI Project (.pbip) save option still sat there, ticked, with two sub-options: Store semantic model using TMDL format and Store reports using enhanced metadata format (PBIR).
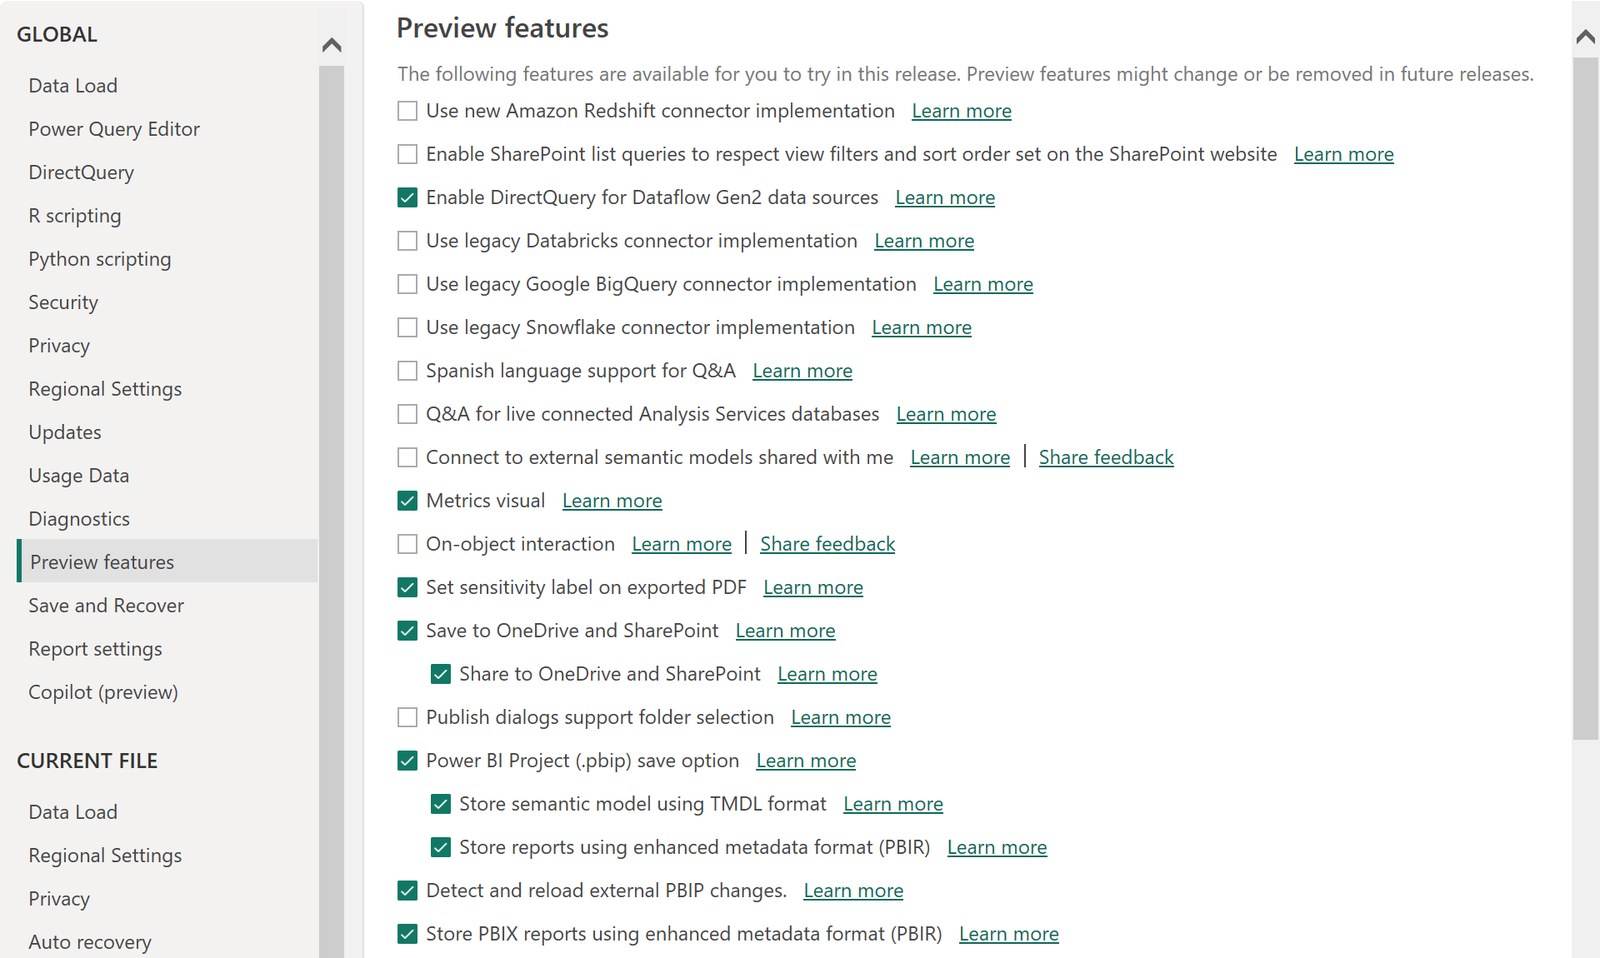
Pitfalls
One writer at a time. Desktop and an external editor can overwrite each other's changes. Desktop only writes to the files when you save, so save there before you edit them. With the preview option Detect and reload external PBIP changes (August 2026 release or later), Desktop offers to Apply external changes, which discards any unsaved work in Desktop.
Desktop rewrites what it saves. After a save in Desktop, files our scripts had written came back reformatted. Positions gained a digit, and files lost their final line break:
-    "y": 358.0851063829787,
+    "y": 358.08510638297872,
Commit that save on its own, so the noise does not hide a real change.
Long paths on Windows. Paths are limited to 260 characters by default, and every visual sits four folders below definition. Long table names count too. Keep the root short: in C:\ColisPro, every visual.json path is 106 characters.
Schema versions. Every JSON file declares its schema in $schema, with the version in the URL. Colis Pro mixes visualContainer 2.13.0 (312 files) and 2.9.0 (35 files) in the same report, and Desktop opens both. When we checked, the 2.13.0 URL returned a 404, so a code editor cannot fetch that schema to check your edits.
Try it
Download Colis Pro, free. Unzip it at the root of C:\ (the zip holds a ColisPro folder), open ColisPro.pbip and click Refresh. Then open the folder in a code editor and read it in this order: pages/pages.json, one page folder, one visual.json, then tables/_Mesures.tmdl. Search the report folder for Points saturés: you land on the three visuals that show it.
If you want this structure without writing it by hand, ChartCraft generates designed Power BI projects as a .pbip folder. Its MCP server lets your agent do it on your own semantic model: the agent sends the declarations from your .tmdl files (names and types, never data) and gets back a report folder to place next to your .SemanticModel.
FAQ
Is PBIP replacing PBIX?
No. PBIX remains a primary format, and Desktop converts between the two in both directions through File > Save as.
Can I edit the files while Desktop is open?
Yes, with the preview option Detect and reload external PBIP changes: save in Desktop first, edit the files, then select Apply external changes.
Do I need Fabric to use a Power BI project?
No. A project is a folder on your disk, any Git host can store it, and Desktop's Publish still uploads it to the Service.