

PBIR & agents
The PBIR validator passes, Desktop disagrees: 7 traps
Microsoft's PBIR validator checks names and the schema, never the render. Seven things it lets through that Power BI Desktop draws differently, each proven by a render.
PBIR, the new Power BI report format, turns a report into folders of JSON: one file per page, one file per visual. Scripts and AI agents can now write reports directly. To keep them honest, Microsoft ships a validator: powerbi-report-author validate, from the npm package @microsoft/powerbi-report-authoring-cli, in public preview.
The first render of Colis Pro passed it with 0 errors and 0 warnings. Here is what Power BI Desktop drew:
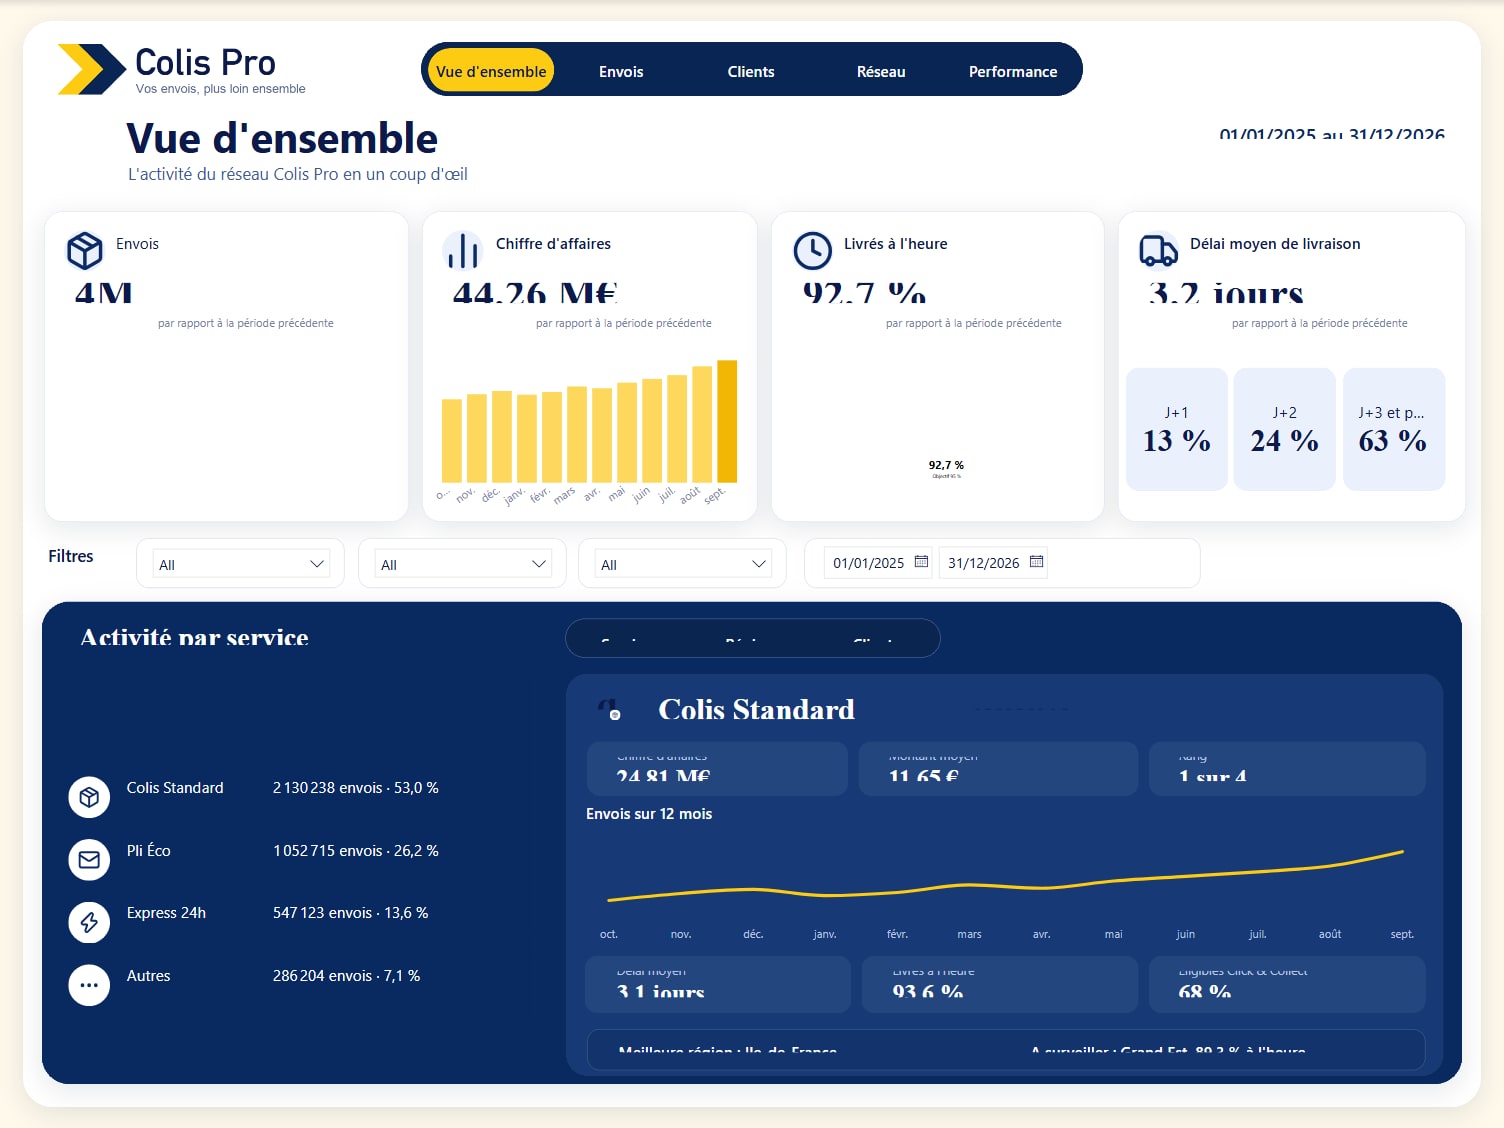
It then took 77 rounds of comparing the JSON with what Power BI Desktop actually drew to reach the final report.
This article lists what the validator lets through. Every point was settled by a render, not by reading the docs.
What the validator checks, and what it doesn't
The validator is a schema checker. It rejects unknown objects, unknown properties and enum values that don't exist. It does not check selectors, preset names or flag values, it does not check where a property sits, and it never renders anything.
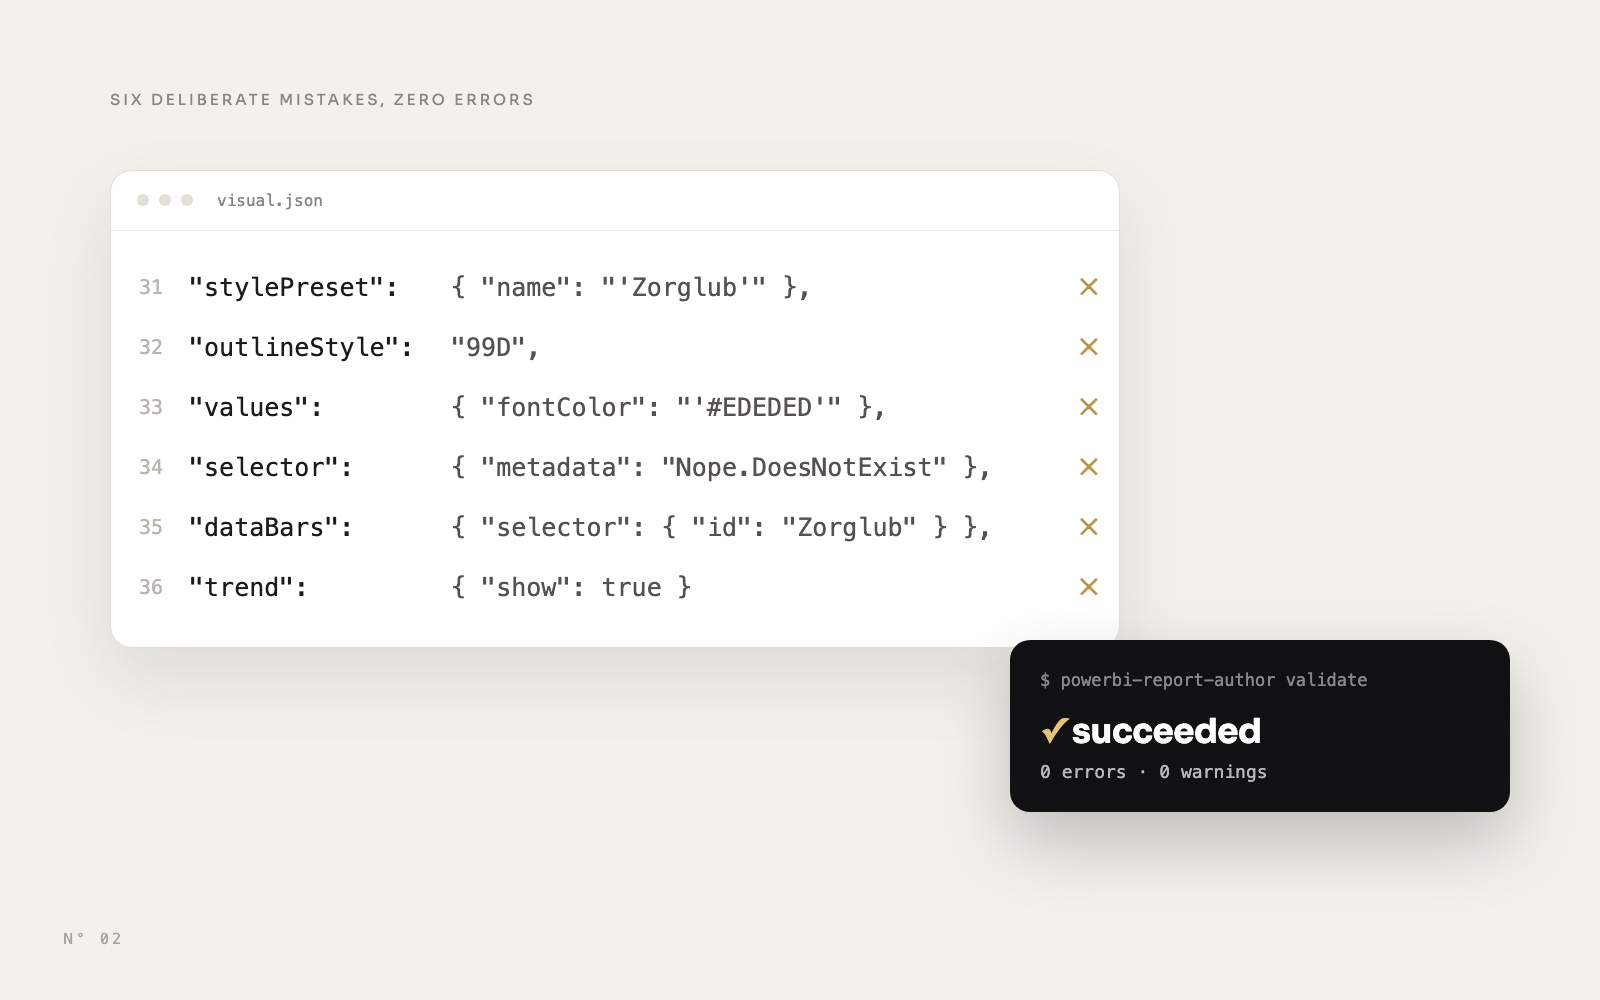
To make the point concrete, we fed it a visual with every one of these deliberately wrong:
"stylePreset":  { "name": "'Zorglub'" },
"outlineStyle": "99D",
"values":       { "fontColor": "'#EDEDED'" },
"selector":     { "metadata": "Nope.DoesNotExist" },
"dataBars":     { "selector": { "id": "Zorglub" } },
"trend":        { "show": true }
Versions 0.1.4 and 0.4.0 of the validator both answered the same thing: succeeded, 0 errors, 0 warnings. It is a spell checker. Necessary, fast, and blind to what Desktop will draw.
1. The same property, in the wrong entry, is ignored
Formatting objects in visual.json are arrays of entries. An entry with a selector applies to one series or one data point. An entry without a selector applies to the whole visual. Some properties only take effect in the entry without a selector, and the validator accepts them anywhere.
The area under a line chart is one of them. Put areaShow and showMarker under a series selector and Desktop draws a bare line:
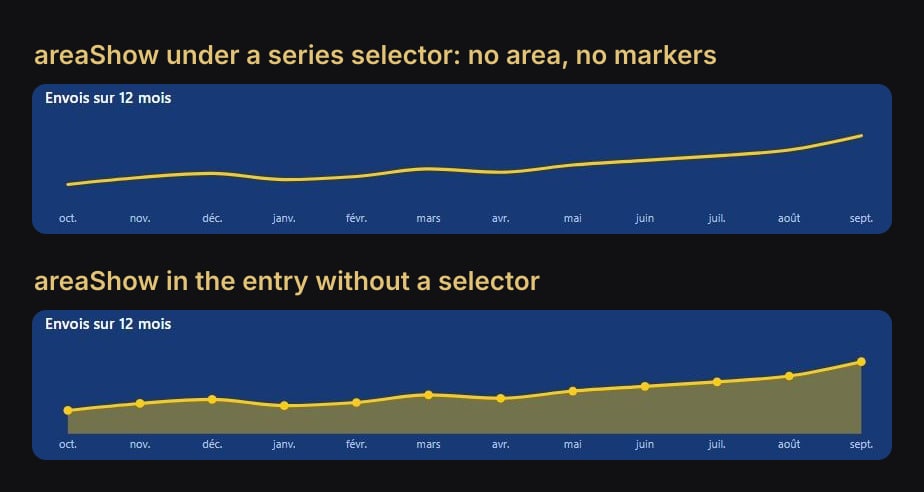
"lineStyles": [{
  "properties": {
    "areaShow":   { "expr": { "Literal": { "Value": "true" } } },
    "showMarker": { "expr": { "Literal": { "Value": "true" } } }
  }
}]
The same rule bit us twice more. A button's text.show needs an entry without a selector, or the button renders with no label. And a new card's value.show: false has to be set both in the default entry and in an entry without a selector.
2. Borders are a clockwise bitmask
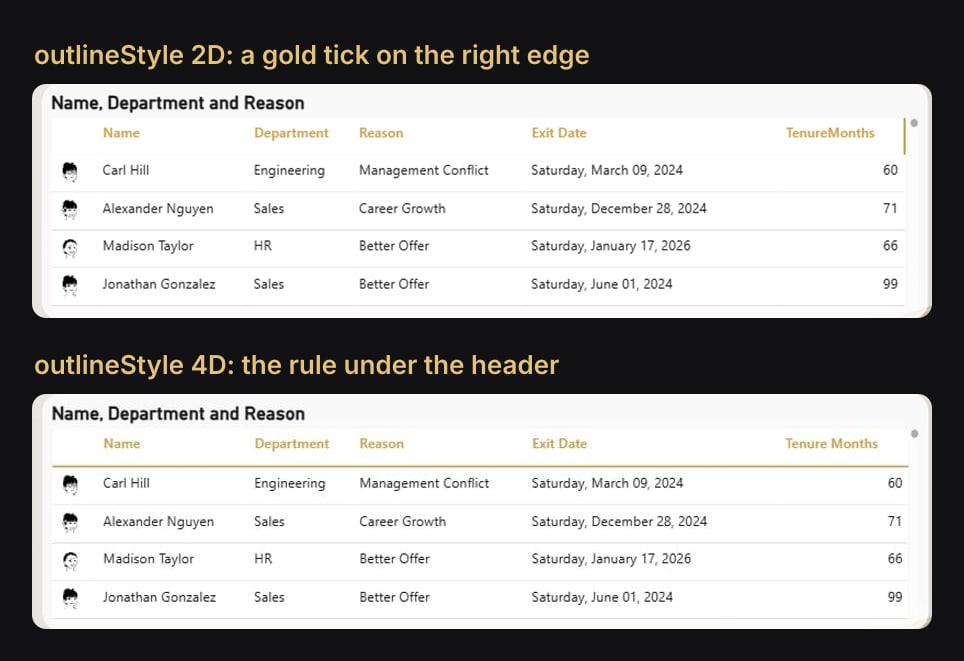
outlineStyle is not a style name. It is a set of flags, one per side, added together. The schema lists the allowed values without saying which side is which. A natural guess is that 2 means "a rule under the header". In Desktop, 2 draws the right edge.
"columnHeaders": [{
  "properties": {
    "outlineStyle":  { "expr": { "Literal": { "Value": "4D" } } },
    "outlineWeight": { "expr": { "Literal": { "Value": "2D" } } }
  }
}]
We rendered 2 and 4. That 1 is the top and 8 the left follows from the clockwise order; combinations add up, so 5 is top and bottom and 15 is a full frame.
3. The new card visual clips its own value
The new card visual (cardVisual) keeps outer margins by default. On a tight layout, the value drops about 10 px and loses its lower half. "12 430" becomes a sliced "12K".

The fix is in the layout object, in the default entry:
"layout": [{
  "properties": {
    "topOuterMargin":    { "expr": { "Literal": { "Value": "0L" } } },
    "bottomOuterMargin": { "expr": { "Literal": { "Value": "0L" } } },
    "leftOuterMargin":   { "expr": { "Literal": { "Value": "0L" } } },
    "rightOuterMargin":  { "expr": { "Literal": { "Value": "0L" } } },
    "paddingUniform":    { "expr": { "Literal": { "Value": "0L" } } }
  },
  "selector": { "id": "default" }
}]
Going from "12K" to "12 430" is a second, separate fix: labelDisplayUnits set to 1 on the value.
4. values.fontColor takes rules, not colours
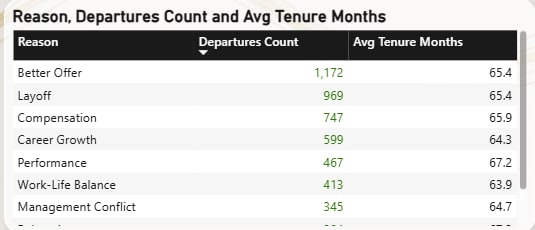
In a table, a fixed colour in values.fontColor is ignored: the text keeps the theme's foreground. Microsoft's own authoring notes say it plainly, and the render agrees. Plain text colours go in fontColorPrimary and fontColorSecondary. fontColor is the slot for a conditional rule, with a selector that names the column:
{
  "properties": {
    "fontColor": { "solid": { "color": { "expr": { "Conditional": { "Cases": [ … ] } } } } }
  },
  "selector": {
    "data": [{ "dataViewWildcard": { "matchingOption": 1 } }],
    "metadata": "_Measures.Retention Variation MoM"
  }
}
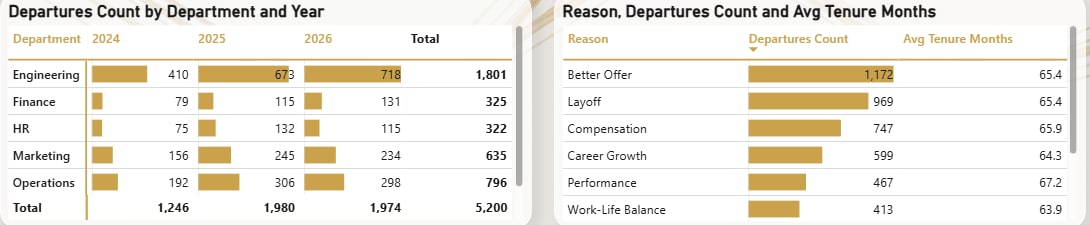
Data bars follow a different selector shape: columnFormatting.dataBars with the column's metadata alone. They draw in the cells, not in the totals.
5. The matrix total escapes its header band
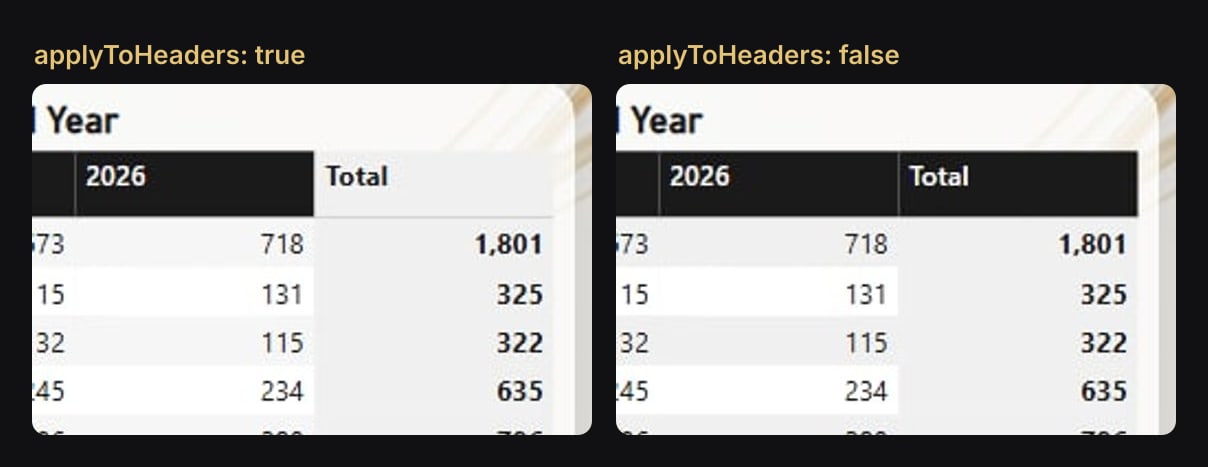
On a matrix with a dark header band, it is tempting to copy applyToHeaders: true from rowTotal to columnTotal. The "Total" header cell then turns light, a hole in the middle of the band.
"columnTotal": [{
  "properties": {
    "applyToHeaders": { "expr": { "Literal": { "Value": "false" } } }
  }
}]
rowTotal keeps true. Only the column total needs false.
6. A scatter trend line: valid, never drawn
The trend object is in the scatter chart's schema, with show, combineSeries, style and width. The validator accepts it. With a legend and a size field bound, Desktop draws nothing.
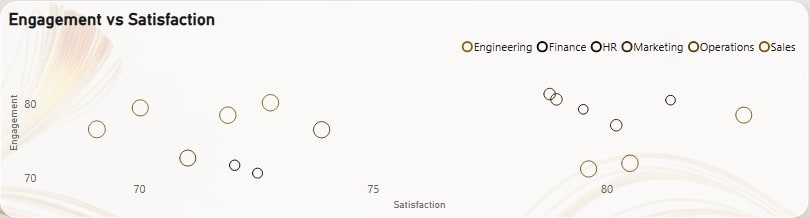
We found no form of it that renders in that configuration. The fix is to drop the object.
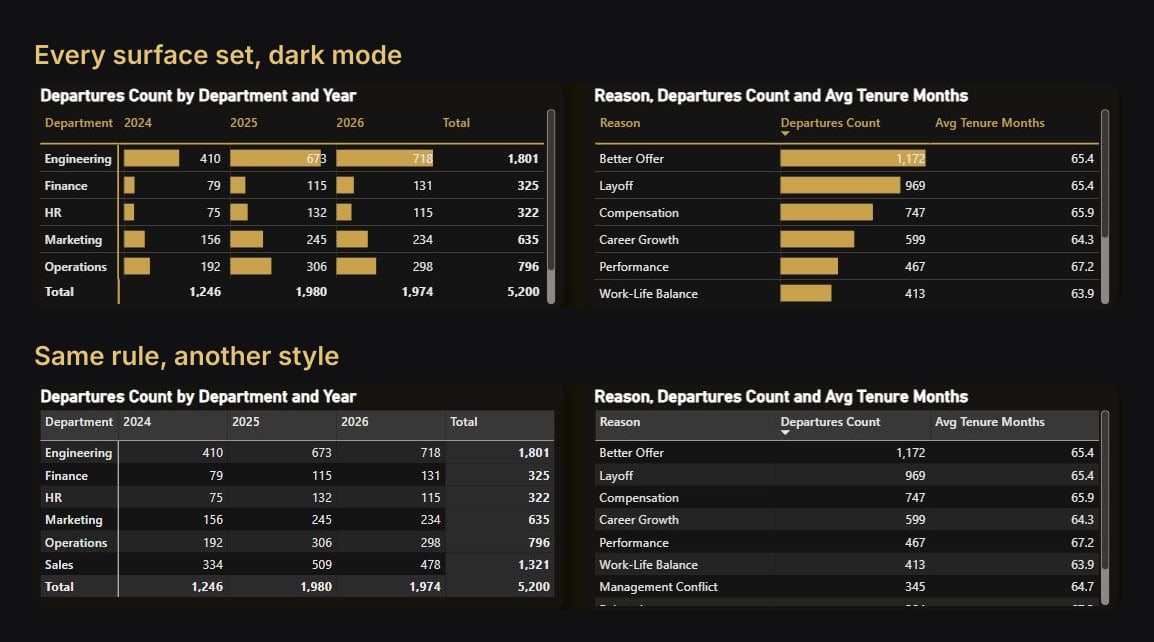
7. Any preset name passes: set every surface
stylePreset accepts any name, including one that doesn't exist. When a table has custom colours, set the preset to 'None' and give every surface its colour: column headers, rows (backColorPrimary and backColorSecondary, fontColorPrimary and fontColorSecondary), totals, and on a matrix the row headers, row and column totals and subtotals. A surface left to the theme falls back to #252423, which is invisible on a dark page.
"visualContainerObjects": {
  "stylePreset": [{ "properties": { "name": { "expr": { "Literal": { "Value": "'None'" } } } } }]
}
Microsoft's notes also warn that the default preset repaints custom colours. Our renders did not reproduce that: tables without any stylePreset kept their colours. The risk we did prove is the #252423 fallback.
Two more that pass
- Two fields with the same
nativeQueryRef. Using" "to hide two column headers looks harmless. Desktop shows "Error fetching data for this visual". - A renamed field needs
displayNameandnativeQueryRef. Set only one and the old name comes back. Aggregates also need an EnglishdisplayName, or Desktop translates them for a French user ("Nombre de…").
And the reverse: errors that Desktop wrote itself
The validator also flags files that Desktop saved. Colis Pro returns 17 errors on both versions, and every one is a property Desktop wrote: centerBackground on the donut, dropdown on slicers, color nested under labels.backgroundColor, all of which render correctly. Files saved by Desktop also point to a schema URL that returns 404, so the schema check is skipped for them.
Validate for structure, render for truth
The validator is worth running on every change: it catches typos and unknown properties in seconds, offline, even on a Mac. It just can't tell you what the report looks like. If a script or an agent writes your PBIR, it needs to see the render. That is the loop we describe in our article on driving Power BI Desktop from an agent.
Every rule above is baked into ChartCraft's report compiler, so the projects it generates render the way the file says. To see them applied across 347 visuals, download Colis Pro, free.
FAQ
Is the validator useless, then?
No. It catches unknown objects, misspelt properties and invalid enum values instantly. It is necessary, not sufficient.
Which versions did you test?
0.1.4, the version on npm's default channel when we built Colis Pro, and 0.4.0. Both accepted every case in this article.
Where do these rules come from?
From 77 render rounds on Colis Pro and from ChartCraft's compiler, each settled by opening the report in Power BI Desktop and capturing what it drew.