

Field notes
Reviewing is cheap, deciding is the job: how an AI agent built a Power BI report
An AI agent built Colis Pro, a full Power BI report, in 77 rounds. Where the human time went: the brief, calibrated data, contradictions and choices.
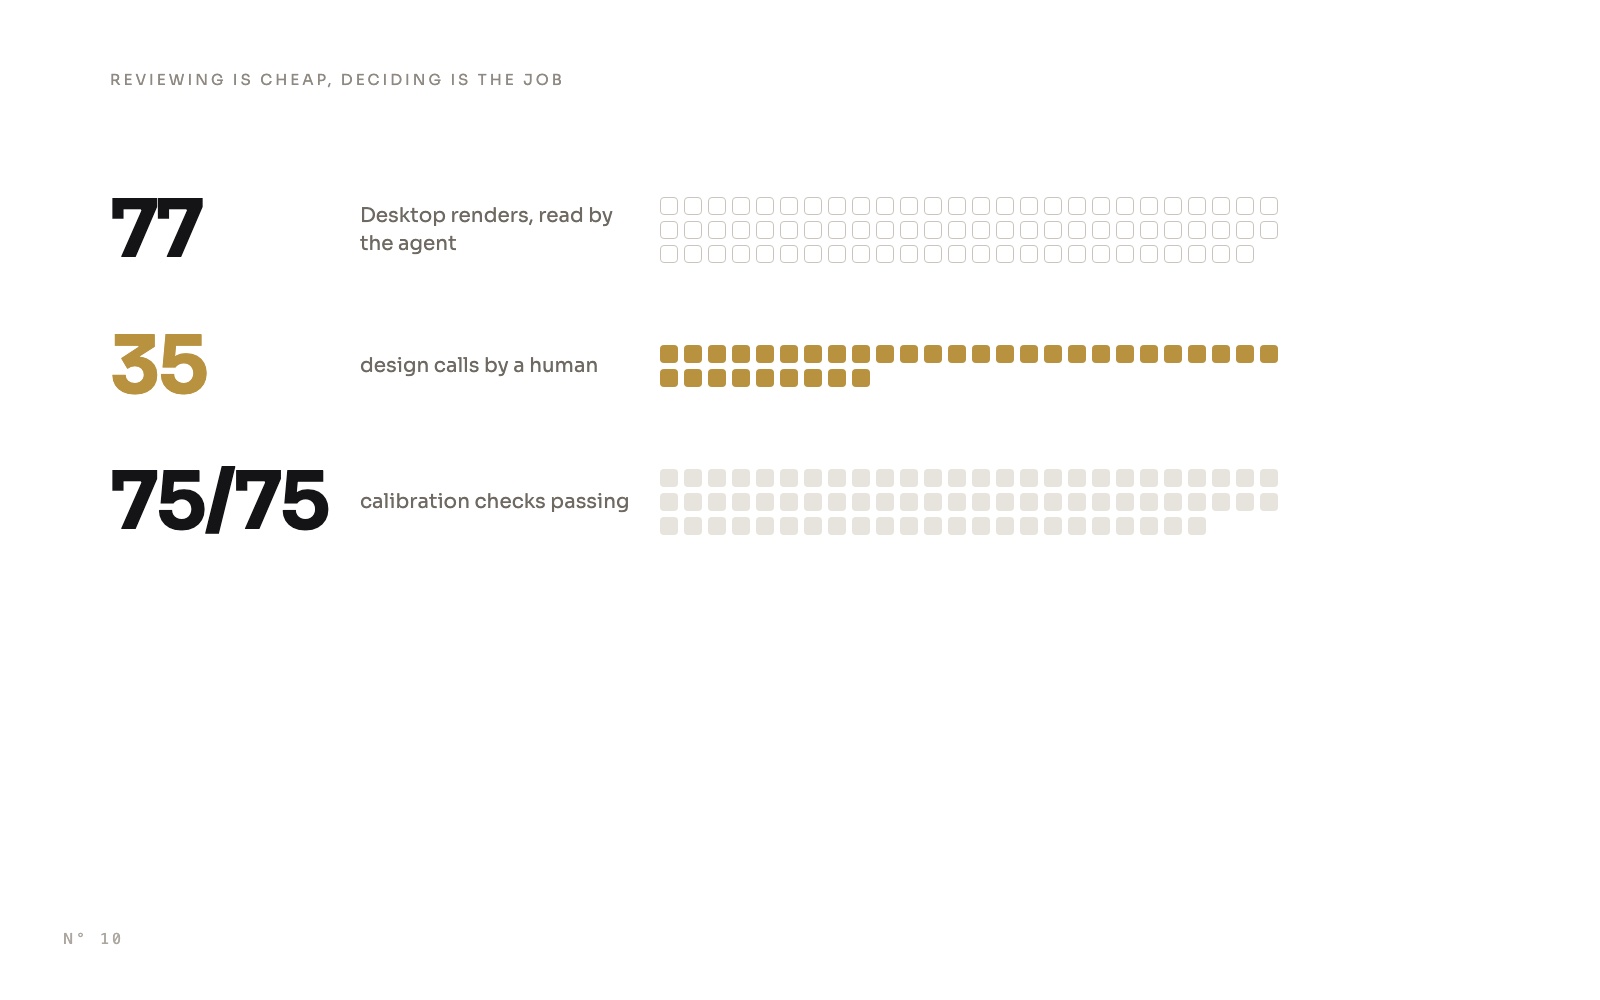
Colis Pro, a free Power BI report built with an AI agent, has 5 pages, an alerts panel, a settings panel and a model of 465 measures. It took 77 rounds in Power BI Desktop to get there. In each round the agent rendered the report, captured the pages and read them. A human made 35 design calls.
That split is the point of this article. With an agent, reviewing became cheap: a full pass over the pages costs one round. What stays expensive is deciding: what good looks like, which number is true, which option wins. Here is the method we used, in five steps, and where the human time went.
The loop, and where a human steps in
Each step below is one part of this loop, with the evidence from Colis Pro.
Step 1: the mockup is a brief, not a spec
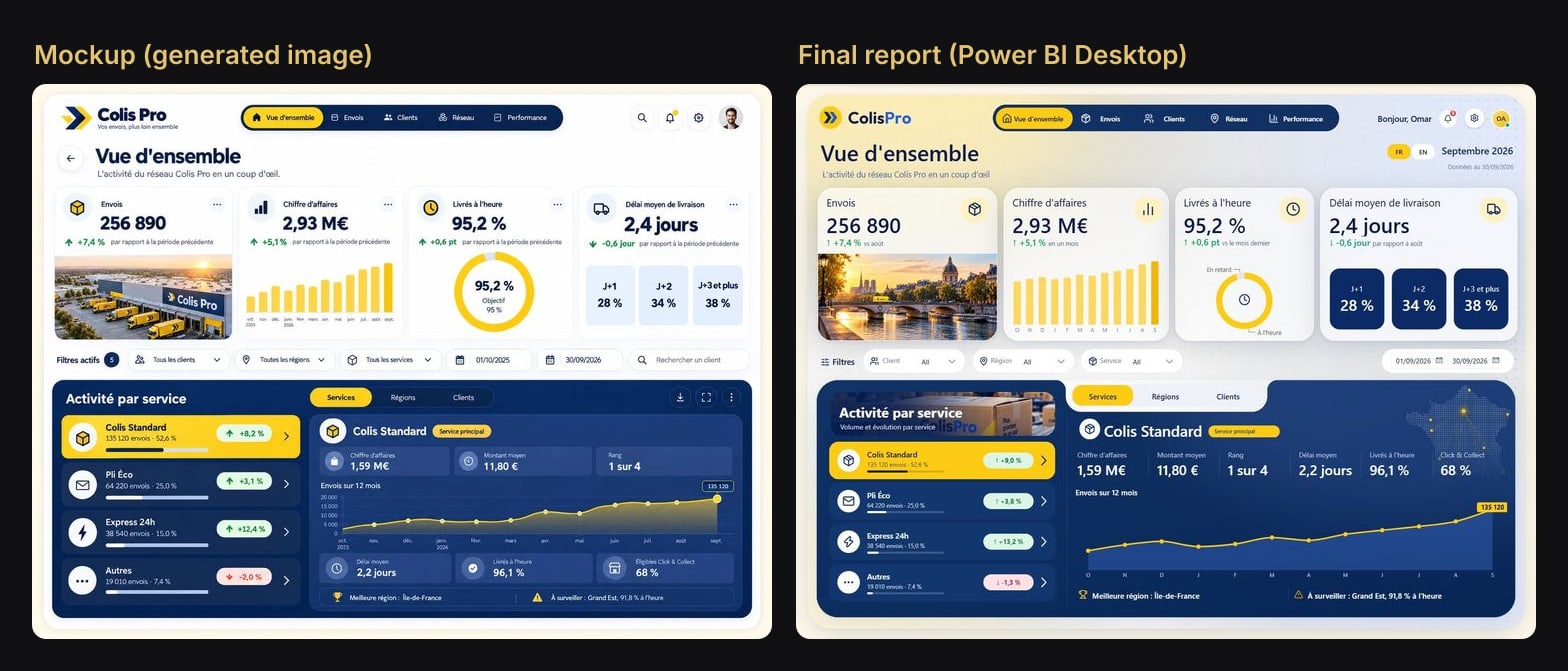
We started from five page mockups, generated as images. They set the layout, the tone and the numbers: 256,890 shipments in September 2026, 2.93 M€ of revenue, 95.2 % delivered on time.
A generated image makes a good brief and a bad spec. It looks finished, but nothing forces its numbers to agree with each other, and some of them can't all be true. So we used the mockups for what they are good at: showing what good looks like. The layout, the hierarchy, the September figures to hit.
That is the first call, and it belongs to a human. An agent can match a picture. It can't decide which picture is the right one, or which parts of it are binding.
Step 2: data generated and calibrated on the mockup
Nothing renders without a model and data. A Python script generates the data, from January 2025 to September 2026: 4,016,280 shipments, plus invoices, customers and the daily stock of 1,248 pickup points. Totals come from deterministic quotas, the rest from random draws with a fixed seed, so every run gives the same data. The quotas are set so that the September 2026 totals land on the mockup's numbers.
A second script checks the result. calibration.py recomputes each figure of the mockups from the data, with the same definition as the matching DAX measure, and compares it with its target:
check("Envois", 256890 * k, len(e1), 256890 * k * 0.005)
check("Envois en retard", 12430 * k, r1, 0)
check("Points saturés", 42, int((occ >= 0.95).sum()), 0)
Each line is a name, a target, the computed value and a tolerance (k scales the data down for quick test runs). Some targets are exact: 12,430 late shipments, 42 saturated pickup points. Others get a tolerance, like the regional on-time rates (0.15 pt). 75 checks, 75 pass.
The same check lives inside the report too. A hidden page shows each key value next to its target: refresh the model, open the page, and if everything matches, the model is right.
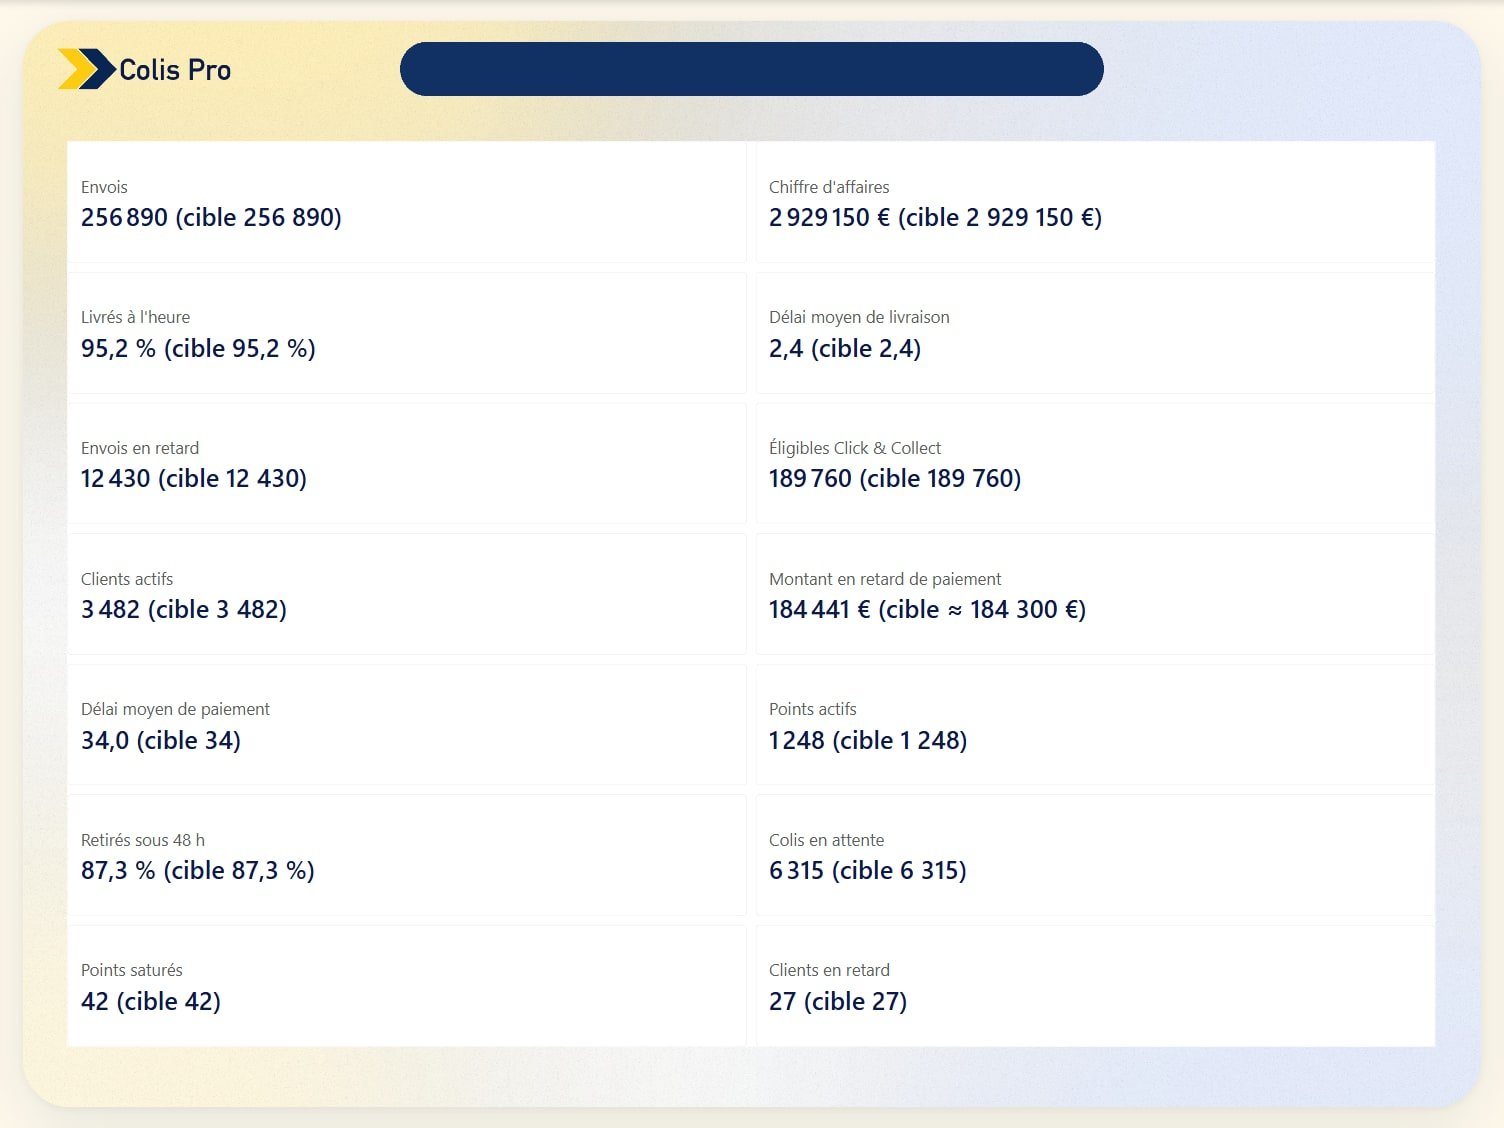
That splits one question in two. Is the data right? The script and this page answer it. Is the report drawing it right? That one only Desktop can answer, in step 4.
Step 3: when the mockup contradicts itself, the data tells one coherent story
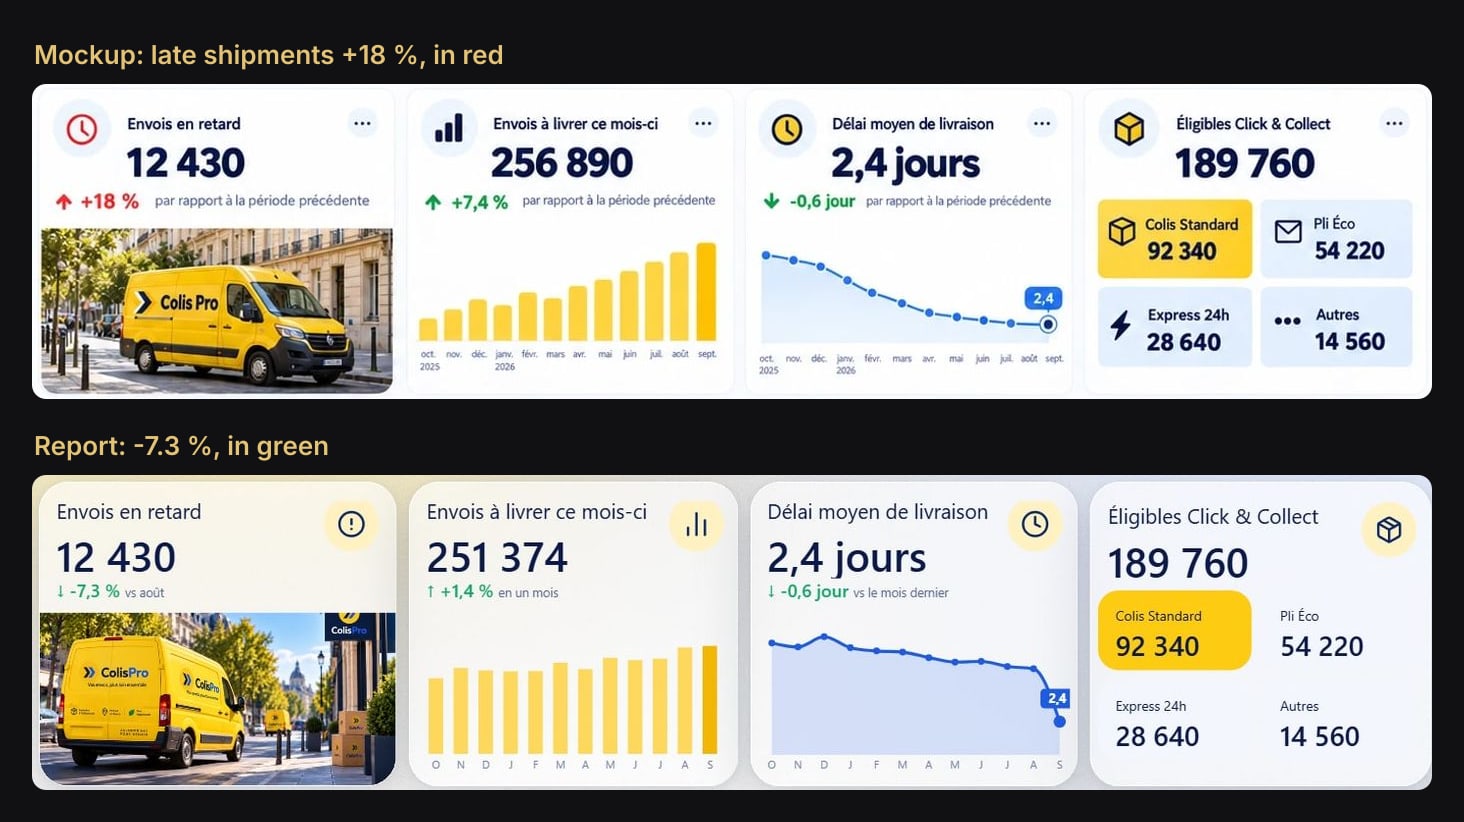
The Shipments mockup shows late shipments up 18 %, in red. The same mockups show the on-time rate up 0.6 pt and the average delivery time down 0.6 day. Those can't all be true in the same month.
The data keeps the mockup's count, 12,430 late shipments, and tells one story instead: delivery improved, so late shipments fall, by 7.3 %, in green.
Some contradictions are plain arithmetic. The mockups give revenue +5.1 %, shipments +7.4 % and an average amount per shipment up 0.3 %. If revenue grows more slowly than shipments, the average amount falls: it has to be -2.1 %, and that is what the data gives.
The work notes list 13 of these gaps, each with the choice made. Shipments due this month come to 251,374, not the mockup's 256,890, because due dates don't fall on the same days as creation dates. A "data as of 27/09" label became 30/09, the day the data ends. The mockup's heat map shows 6 regions while the data covers 13, so the visual is filtered to those 6.
An agent is good at spotting that two numbers can't both hold. Which story the report tells is a call.
Step 4: generate, validate, then let Desktop judge
The first pass placed 222 visuals on the five pages. It passed Microsoft's PBIR validator with 0 errors and 0 warnings, and every field it used existed in the model. Here is what Power BI Desktop drew:
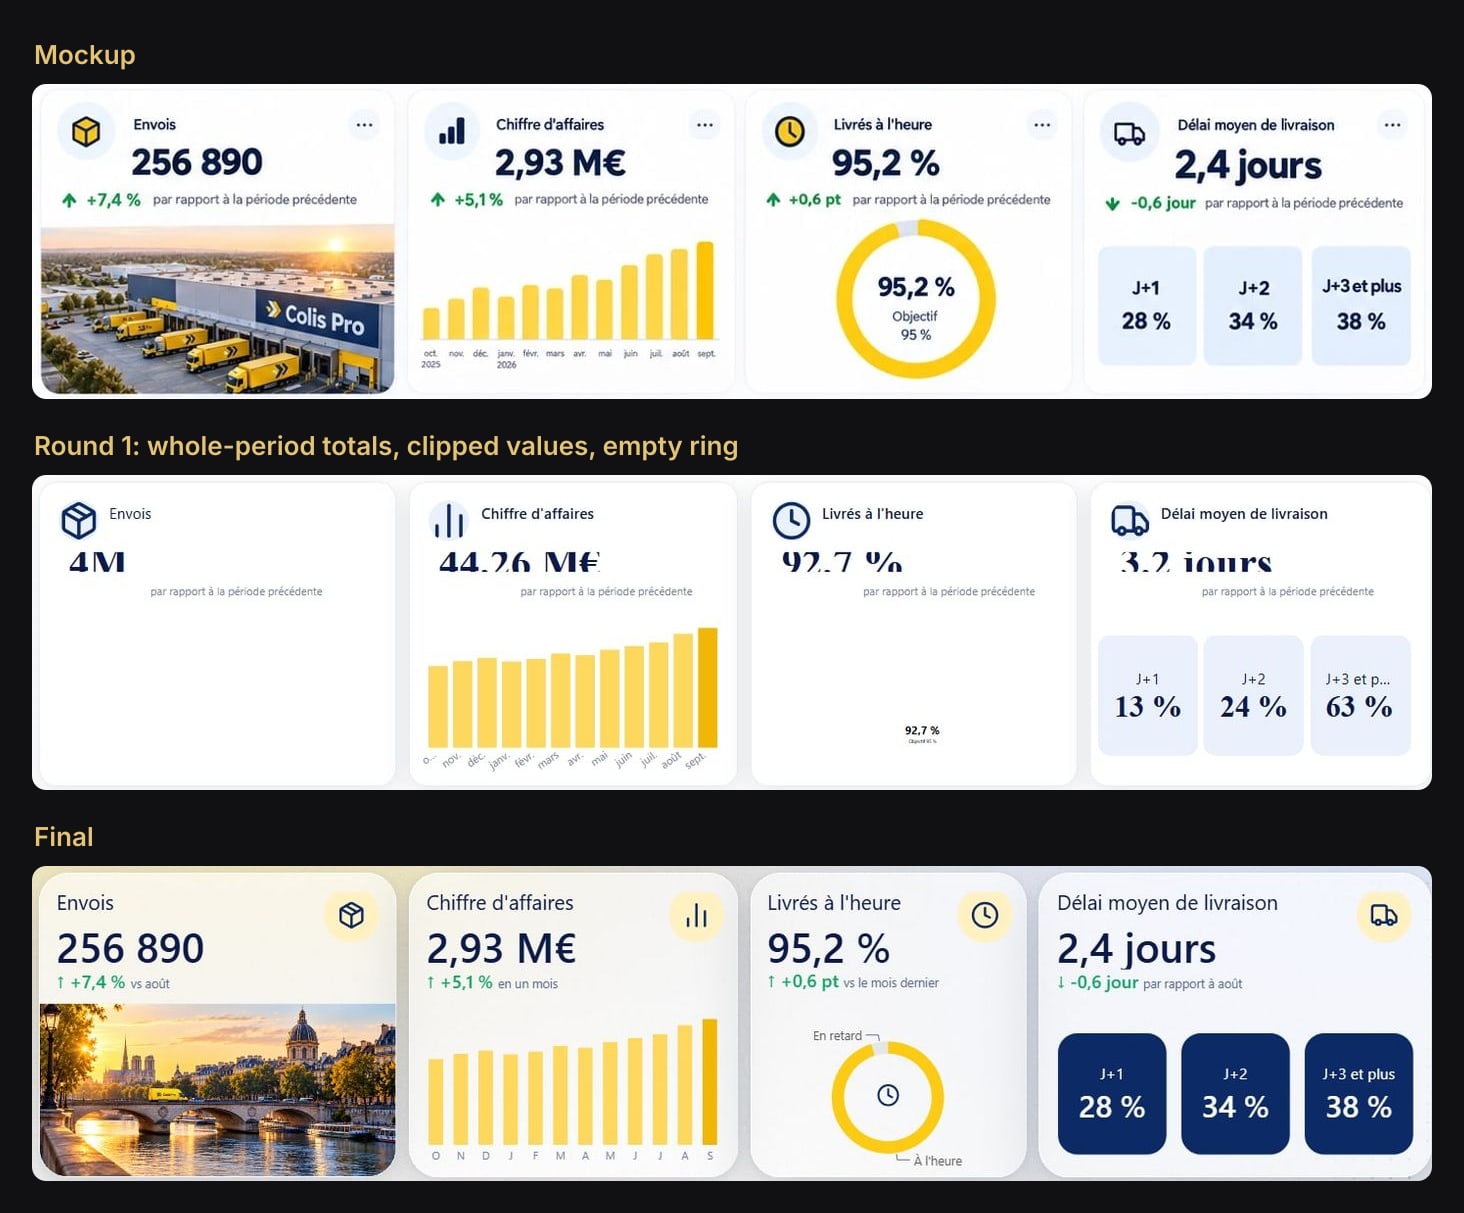
None of it was a schema error. The clipped values came from the default outer margins of the card visual (more in the PBIR validator traps). One of the ring's fixes was in the model: in 18 SVG measures, % had to be encoded as %25 before # became %23, and without it the ring lost all its colours. A validator checks structure. Only a render shows what the reader will see.
So every round ran the same way: reload the project in Desktop, capture the pages, compare each one with its mockup, fix, start again. Desktop runs on Windows; we drove it from a Mac through a bridge (how that works). This is the part that became cheap. The agent read every page it captured, across 77 renders, and between the human calls the loop ran on its own.
Step 5: show options side by side, then make the choice a rule
Some questions have no answer to compute: how to colour the network map, which logo, what goes in an empty corner. For each one, the agent rendered the options side by side, mounted on a real Desktop capture with the real data. The scripts that build these boards write nothing to the report: they produce images to compare.
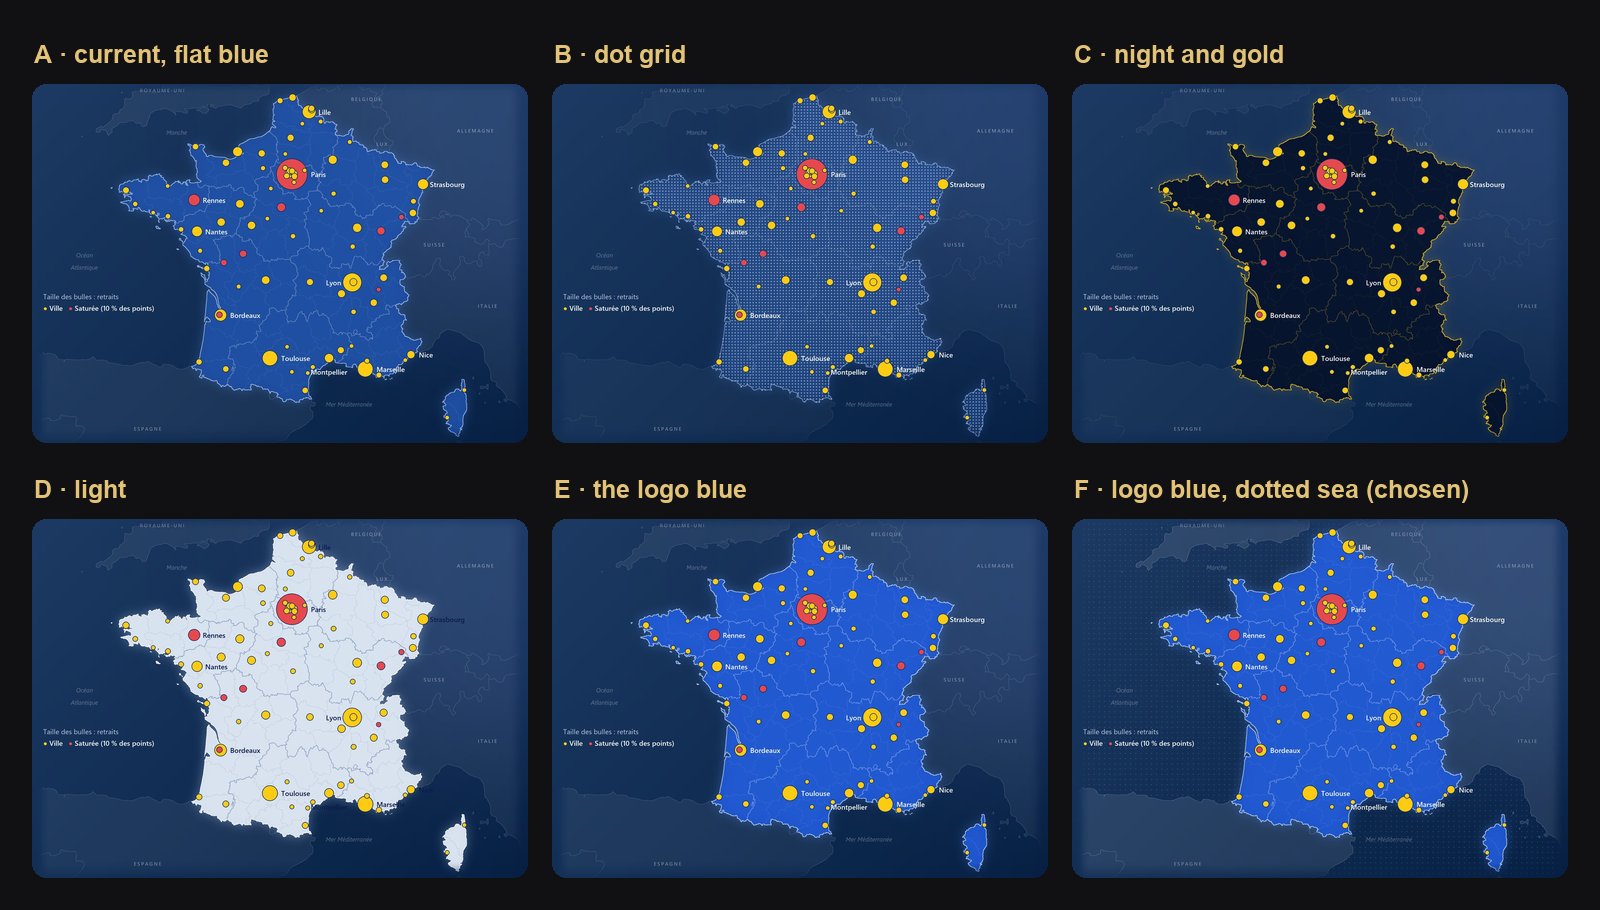
The same pattern settled the rest:
- Logo: four options, L1 to L4, shown on the real page header. L4, a round mark, won, and the agent placed it as a native image on all five pages.
- The empty zone of the Overview panel: a faded photo, a delivery route, chevrons, or France as a dot map. The dot map won.
- The Overview detail panel: two layouts compared on the page. A single surface won.
- Page backgrounds: five styles. "Halo-points" won: yellow and blue glows, a light grain, a faint dot grid in a few corners.
One look, one call, and the agent applied it everywhere.
Hand edits become rules too
Sometimes the fastest way to decide is to do it: open Desktop and adjust the visual by hand. That works too, as long as the edit doesn't stay a one-off.
Once Desktop has saved the project, its files are the truth and nothing is regenerated. Corrections go through scripts such as retouches.py, which edit the visual files in place.
For example, a human tuned the Shipments card of the Overview by hand: title at 15, value at 30 in Semibold, change at 13, a 54 px icon at the top right. That style went to all four Overview cards and all four cards of the Shipments page. Another hand edit made the menu labels appear on one page. The rule that carries it to the other pages is short (docstring translated from French):
def navigation(vi):
    """Navigation buttons: the label was made visible by hand on the Overview, by adding
    a text.show entry with no selector. Same setting on the other pages."""
    lien = vi.v["visual"].get("visualContainerObjects", {}).get("visualLink", [{}])[0].get("properties", {})
    if vi.type == "actionButton" and vi.objs.get("text") and lit_value(lien.get("type", {})) == "'Bookmark'":
        setp(vi.objs, "text", {"show": lit("true")}, None)
One function per correction, the reason in its docstring, and idempotent: running the script again changes nothing more. A --dry-run lists what it would touch.
Where the time went
| What | Count |
|---|---|
| Desktop renders, every page read by the agent | 77 |
| Design calls by a human | 35 |
| Calibration checks passing | 75 of 75 |
| Hand-editing sessions in Desktop, turned into rules | 3 |
The other human messages were go-aheads and logistics.
We didn't time anything, so these are counts, not hours. The repeated work (render, read, compare, recompute) sat with the agent. The human messages that shaped the report were the 35 calls and the 3 editing sessions.
What it means for BI teams
The useful question for a BI team is which parts to keep human. From Colis Pro, three:
- What good looks like. The brief: mockups, references, the figures that matter. The agent can match a picture; it can't choose it.
- Which limit to accept. The bilingual version keeps slicer "All" labels and French number and date formats in both languages (how it works). The network map dropped Azure Maps for a drawn map (why). Those are trade-offs, and someone has to own them.
- Which option wins. Ask the agent for options, side by side, on the real page, rather than for one proposal.
Give the rest to the loop: render every page, recompute every number, apply each choice everywhere, and keep a rule for every hand edit.
Try it
Download Colis Pro, free: the report, the model with its 465 measures, the generated data, and the two scripts behind it, generate_data.py and calibration.py. The hidden page Recette is still in the report: refresh, open it, and each value sits next to its target.
If you want a designed report on your own model without running this loop yourself, ChartCraft generates designed Power BI projects, and its MCP server lets your agent build one on your semantic model.
FAQ
Which agent built Colis Pro?
Claude Code, editing the project files directly and rendering each round in Power BI Desktop through a bridge.
Do the mockups need to be accurate?
No. They are a brief: Colis Pro's mockups disagreed with themselves in 13 places, and the data settled each one.
Isn't the PBIR validator enough?
No. The first pass had 0 errors and 0 warnings and still rendered whole-period totals, clipped values and an empty ring. Validate for structure, render for truth.