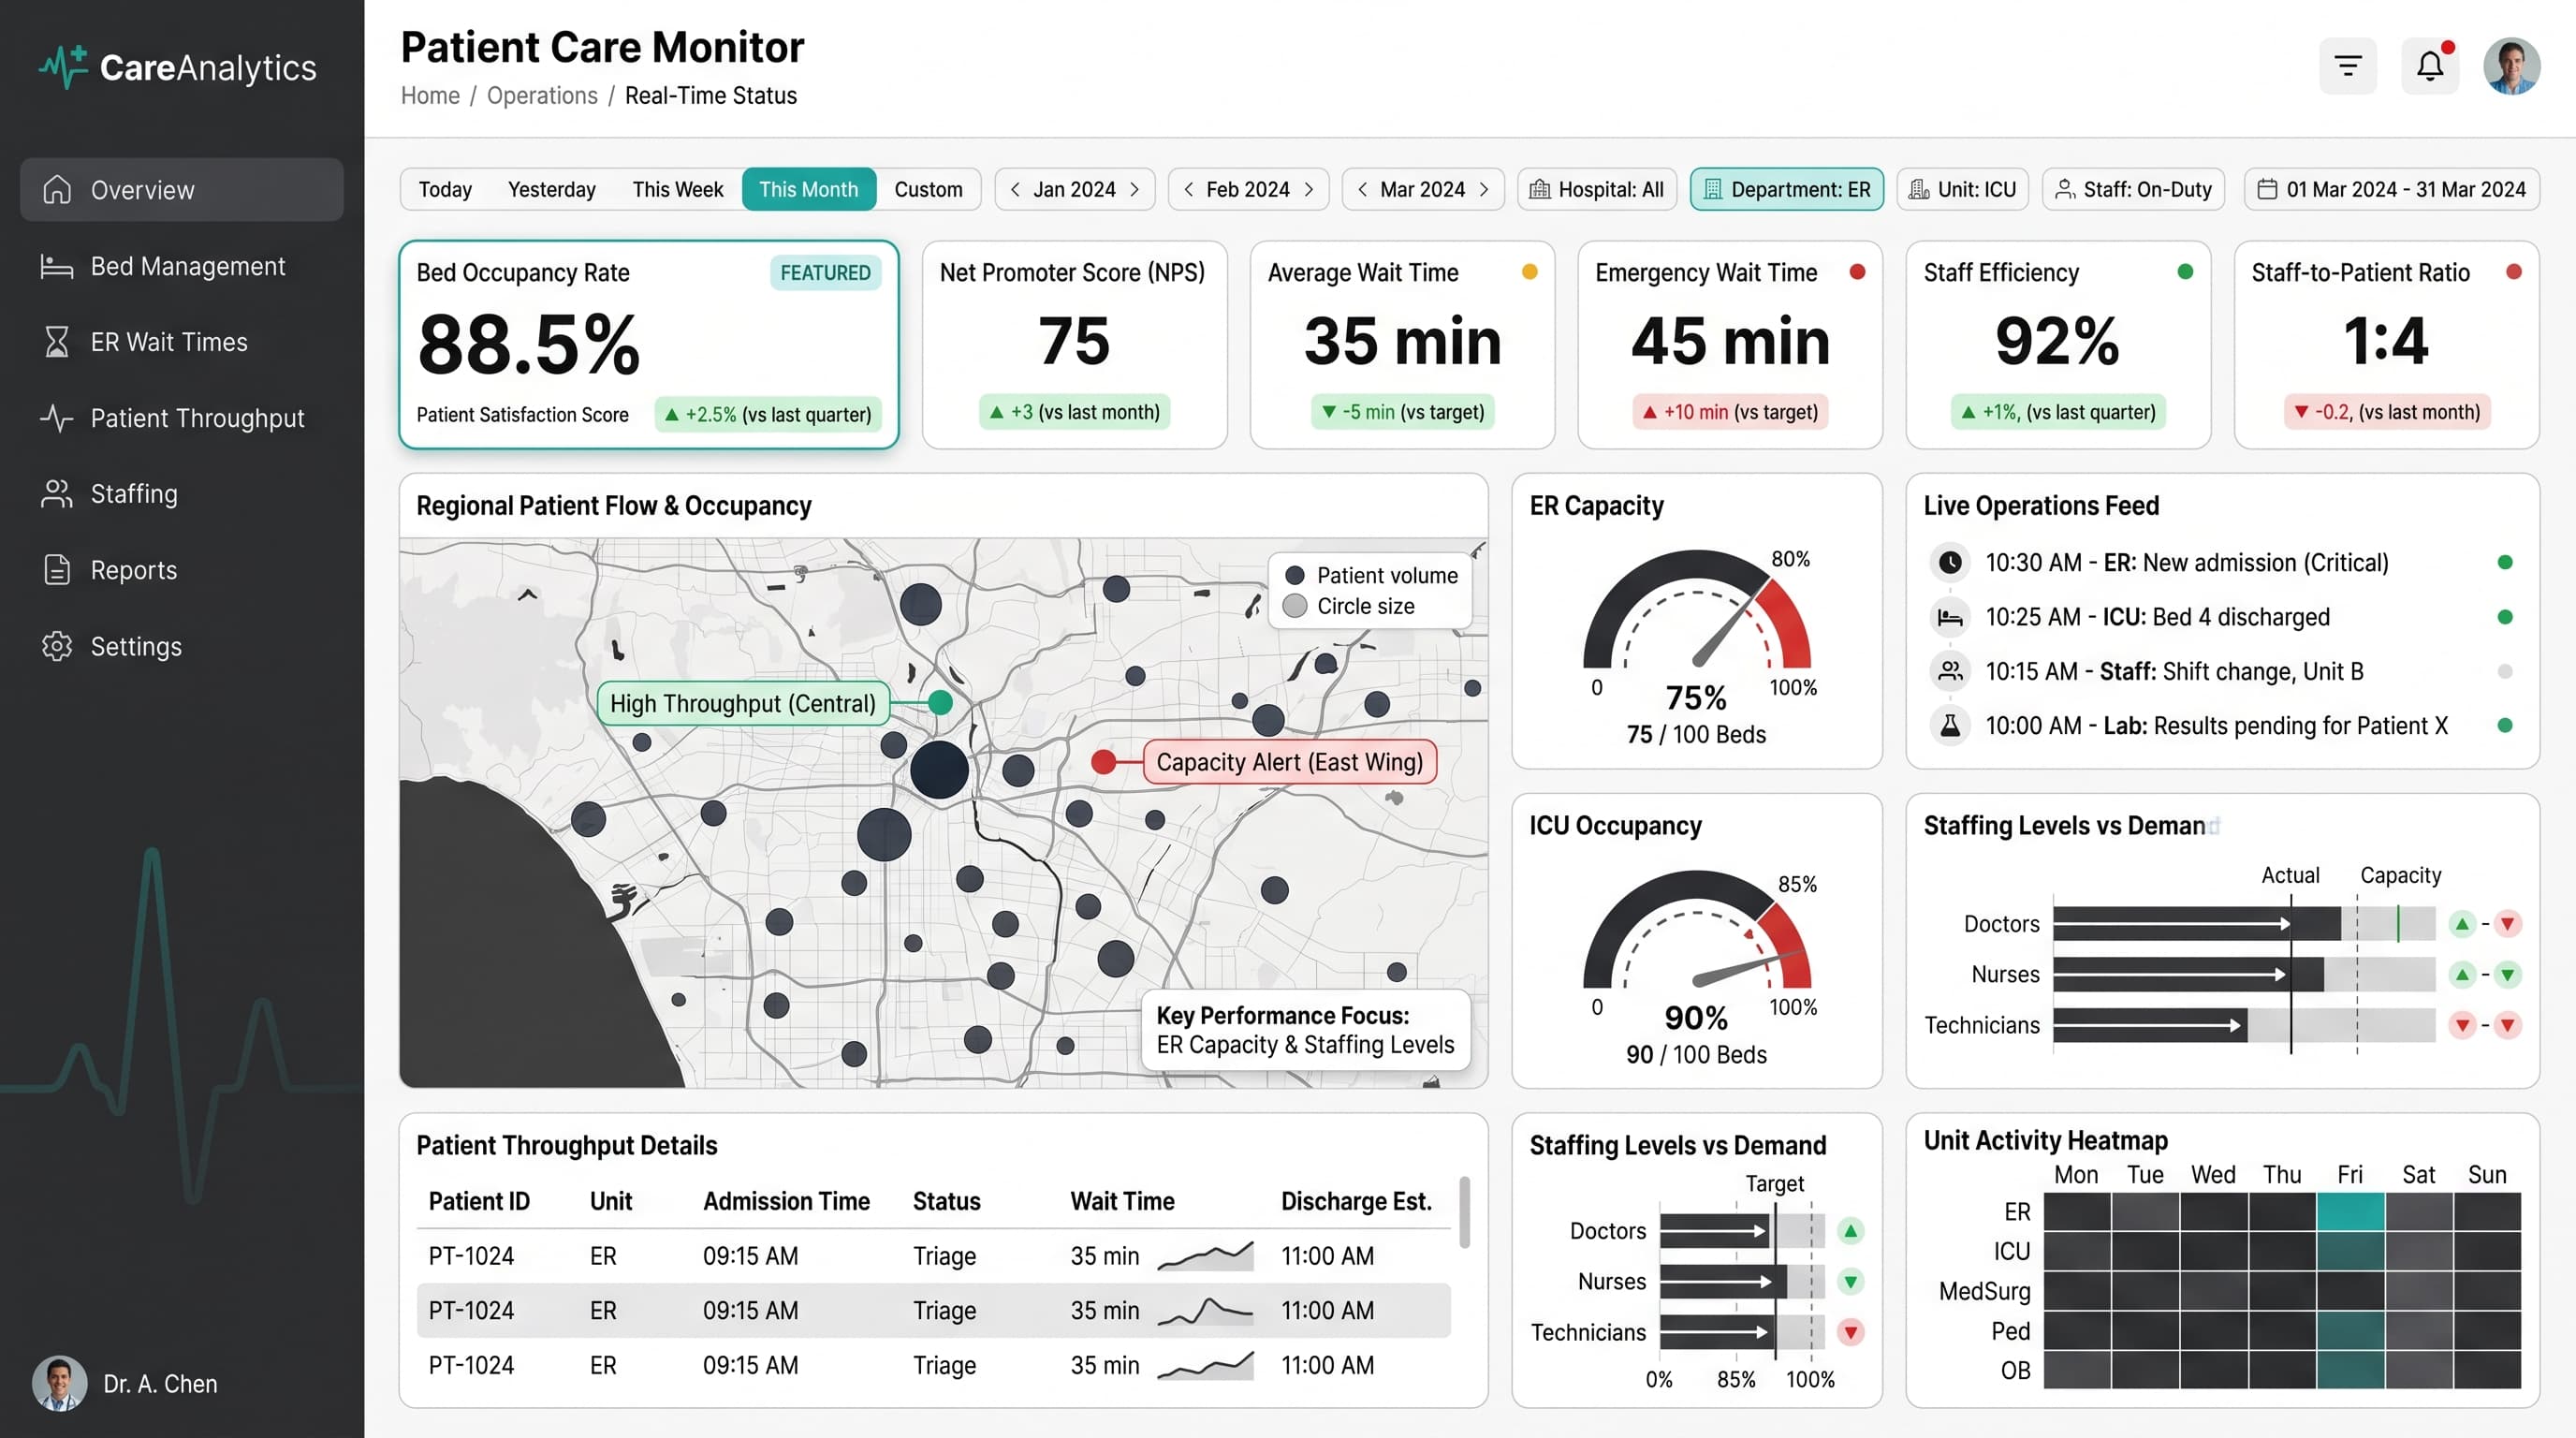
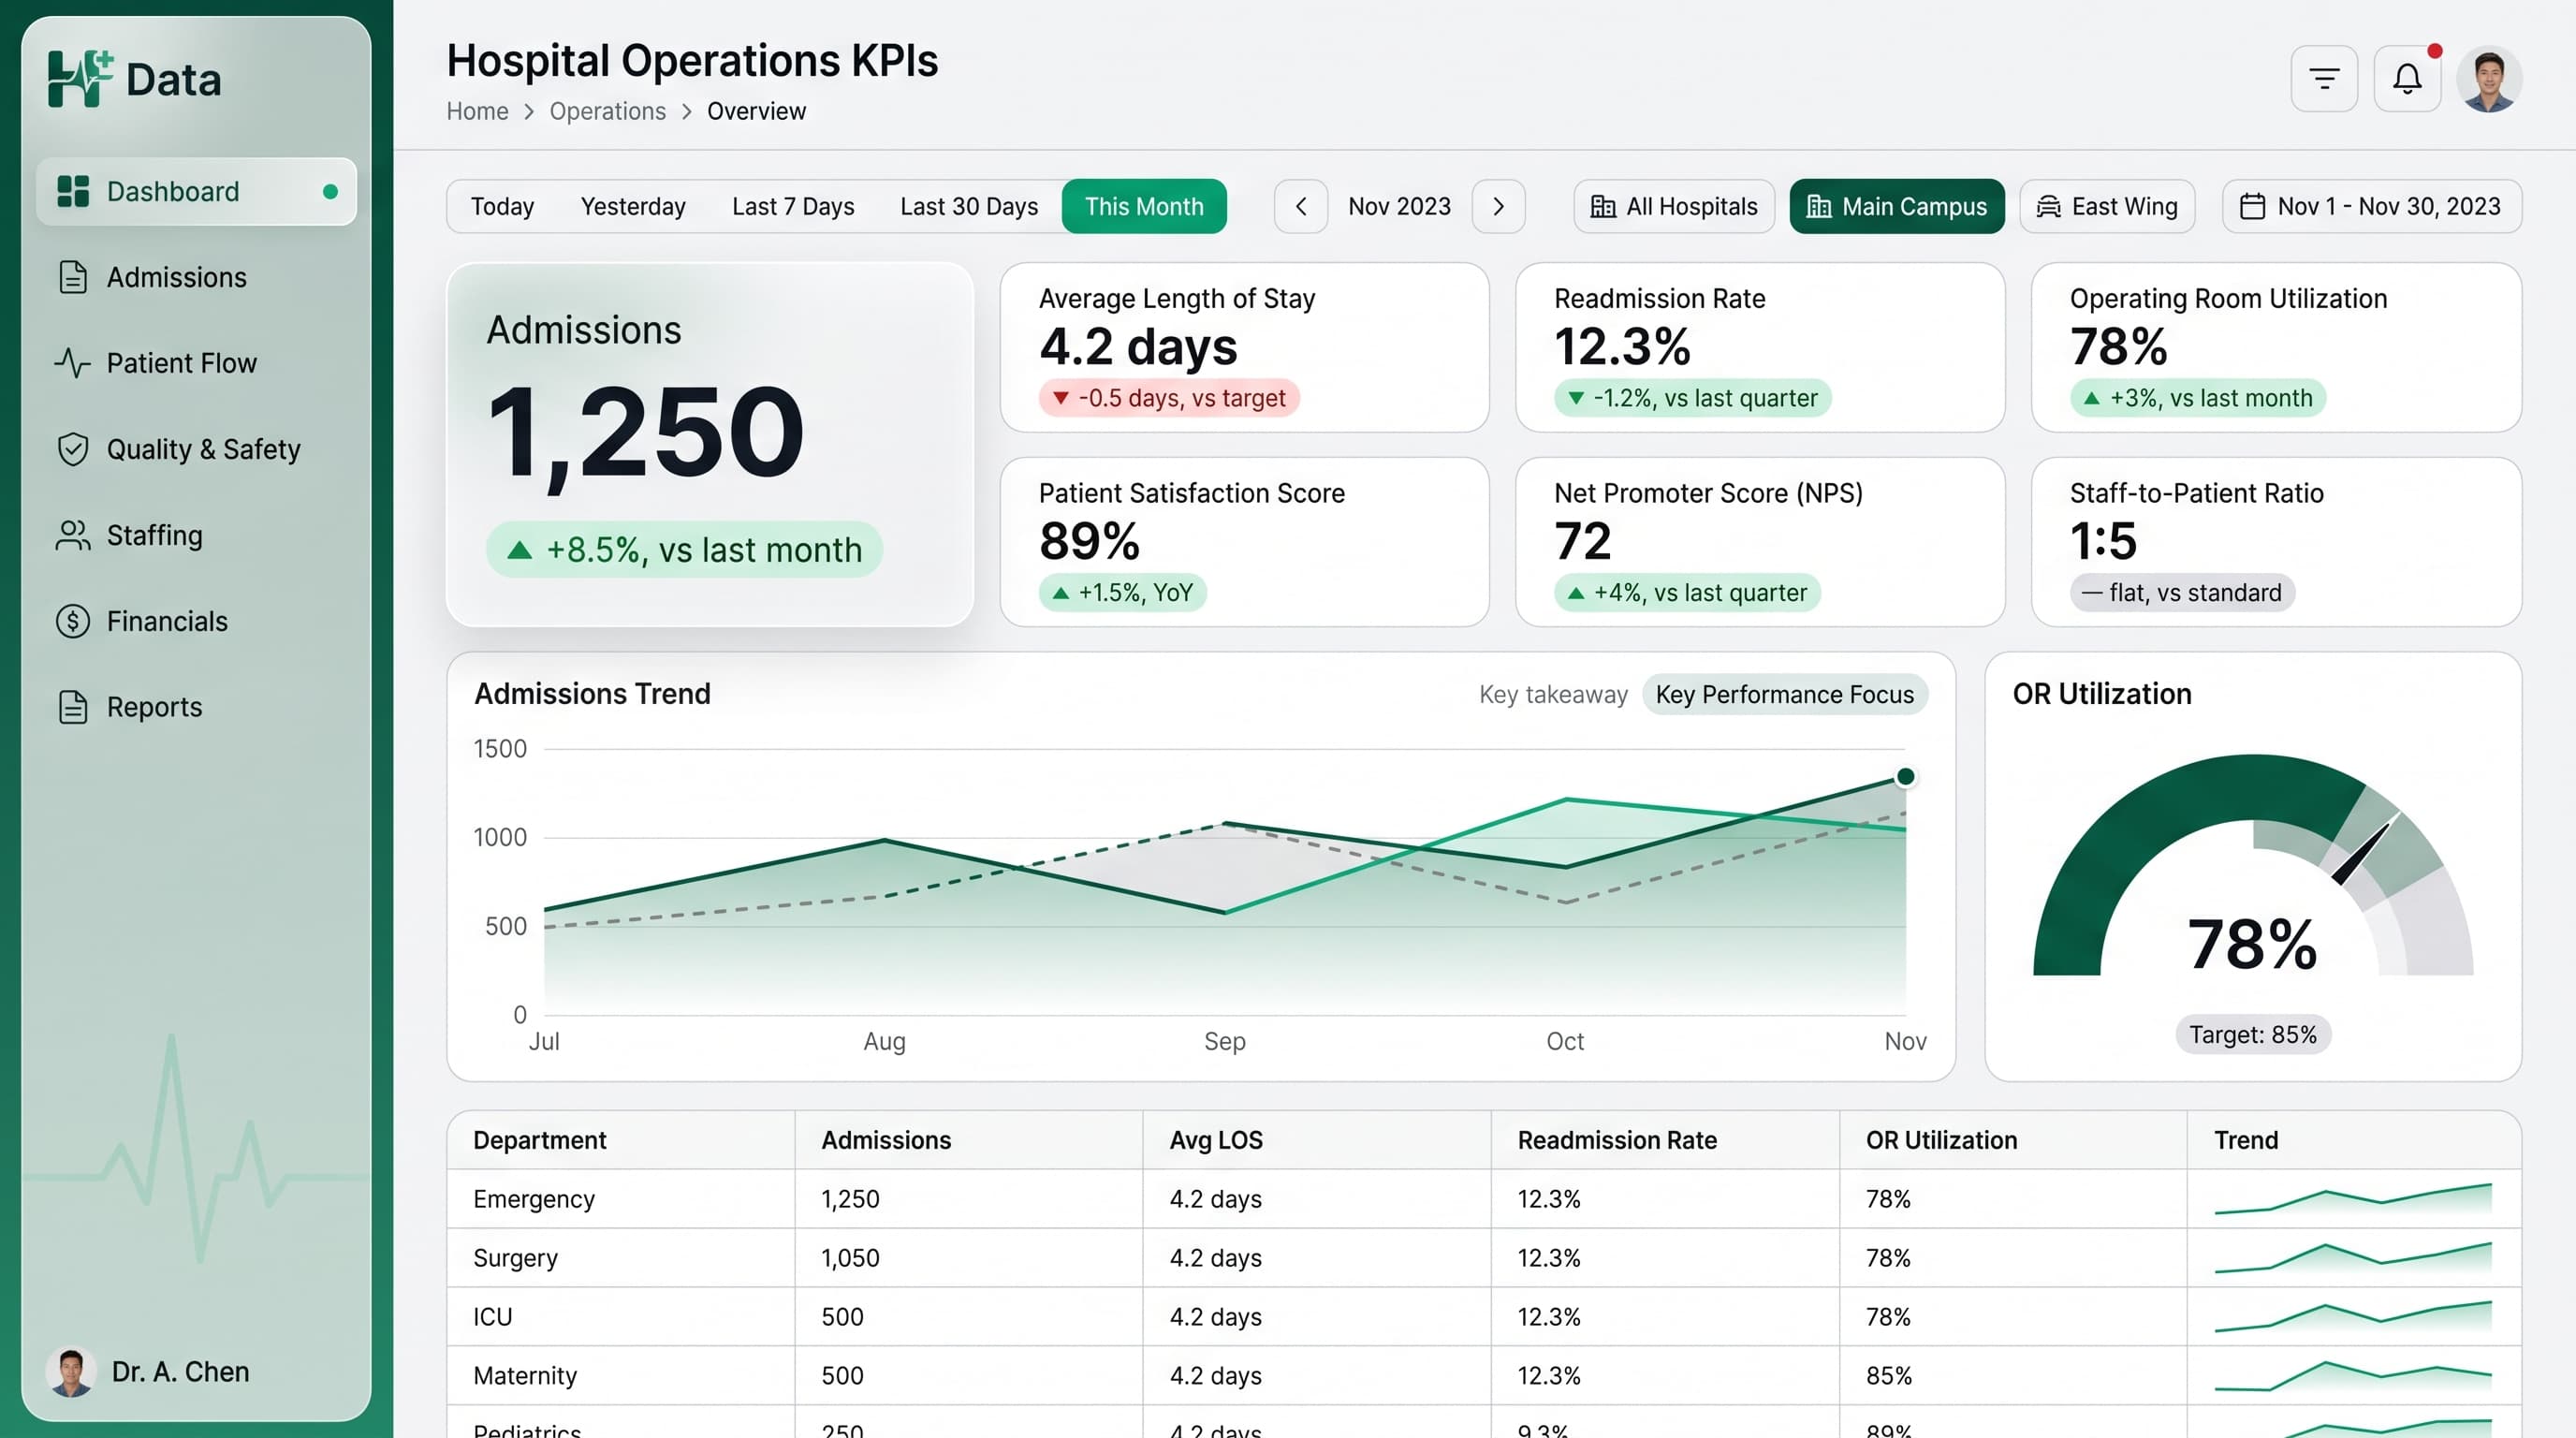
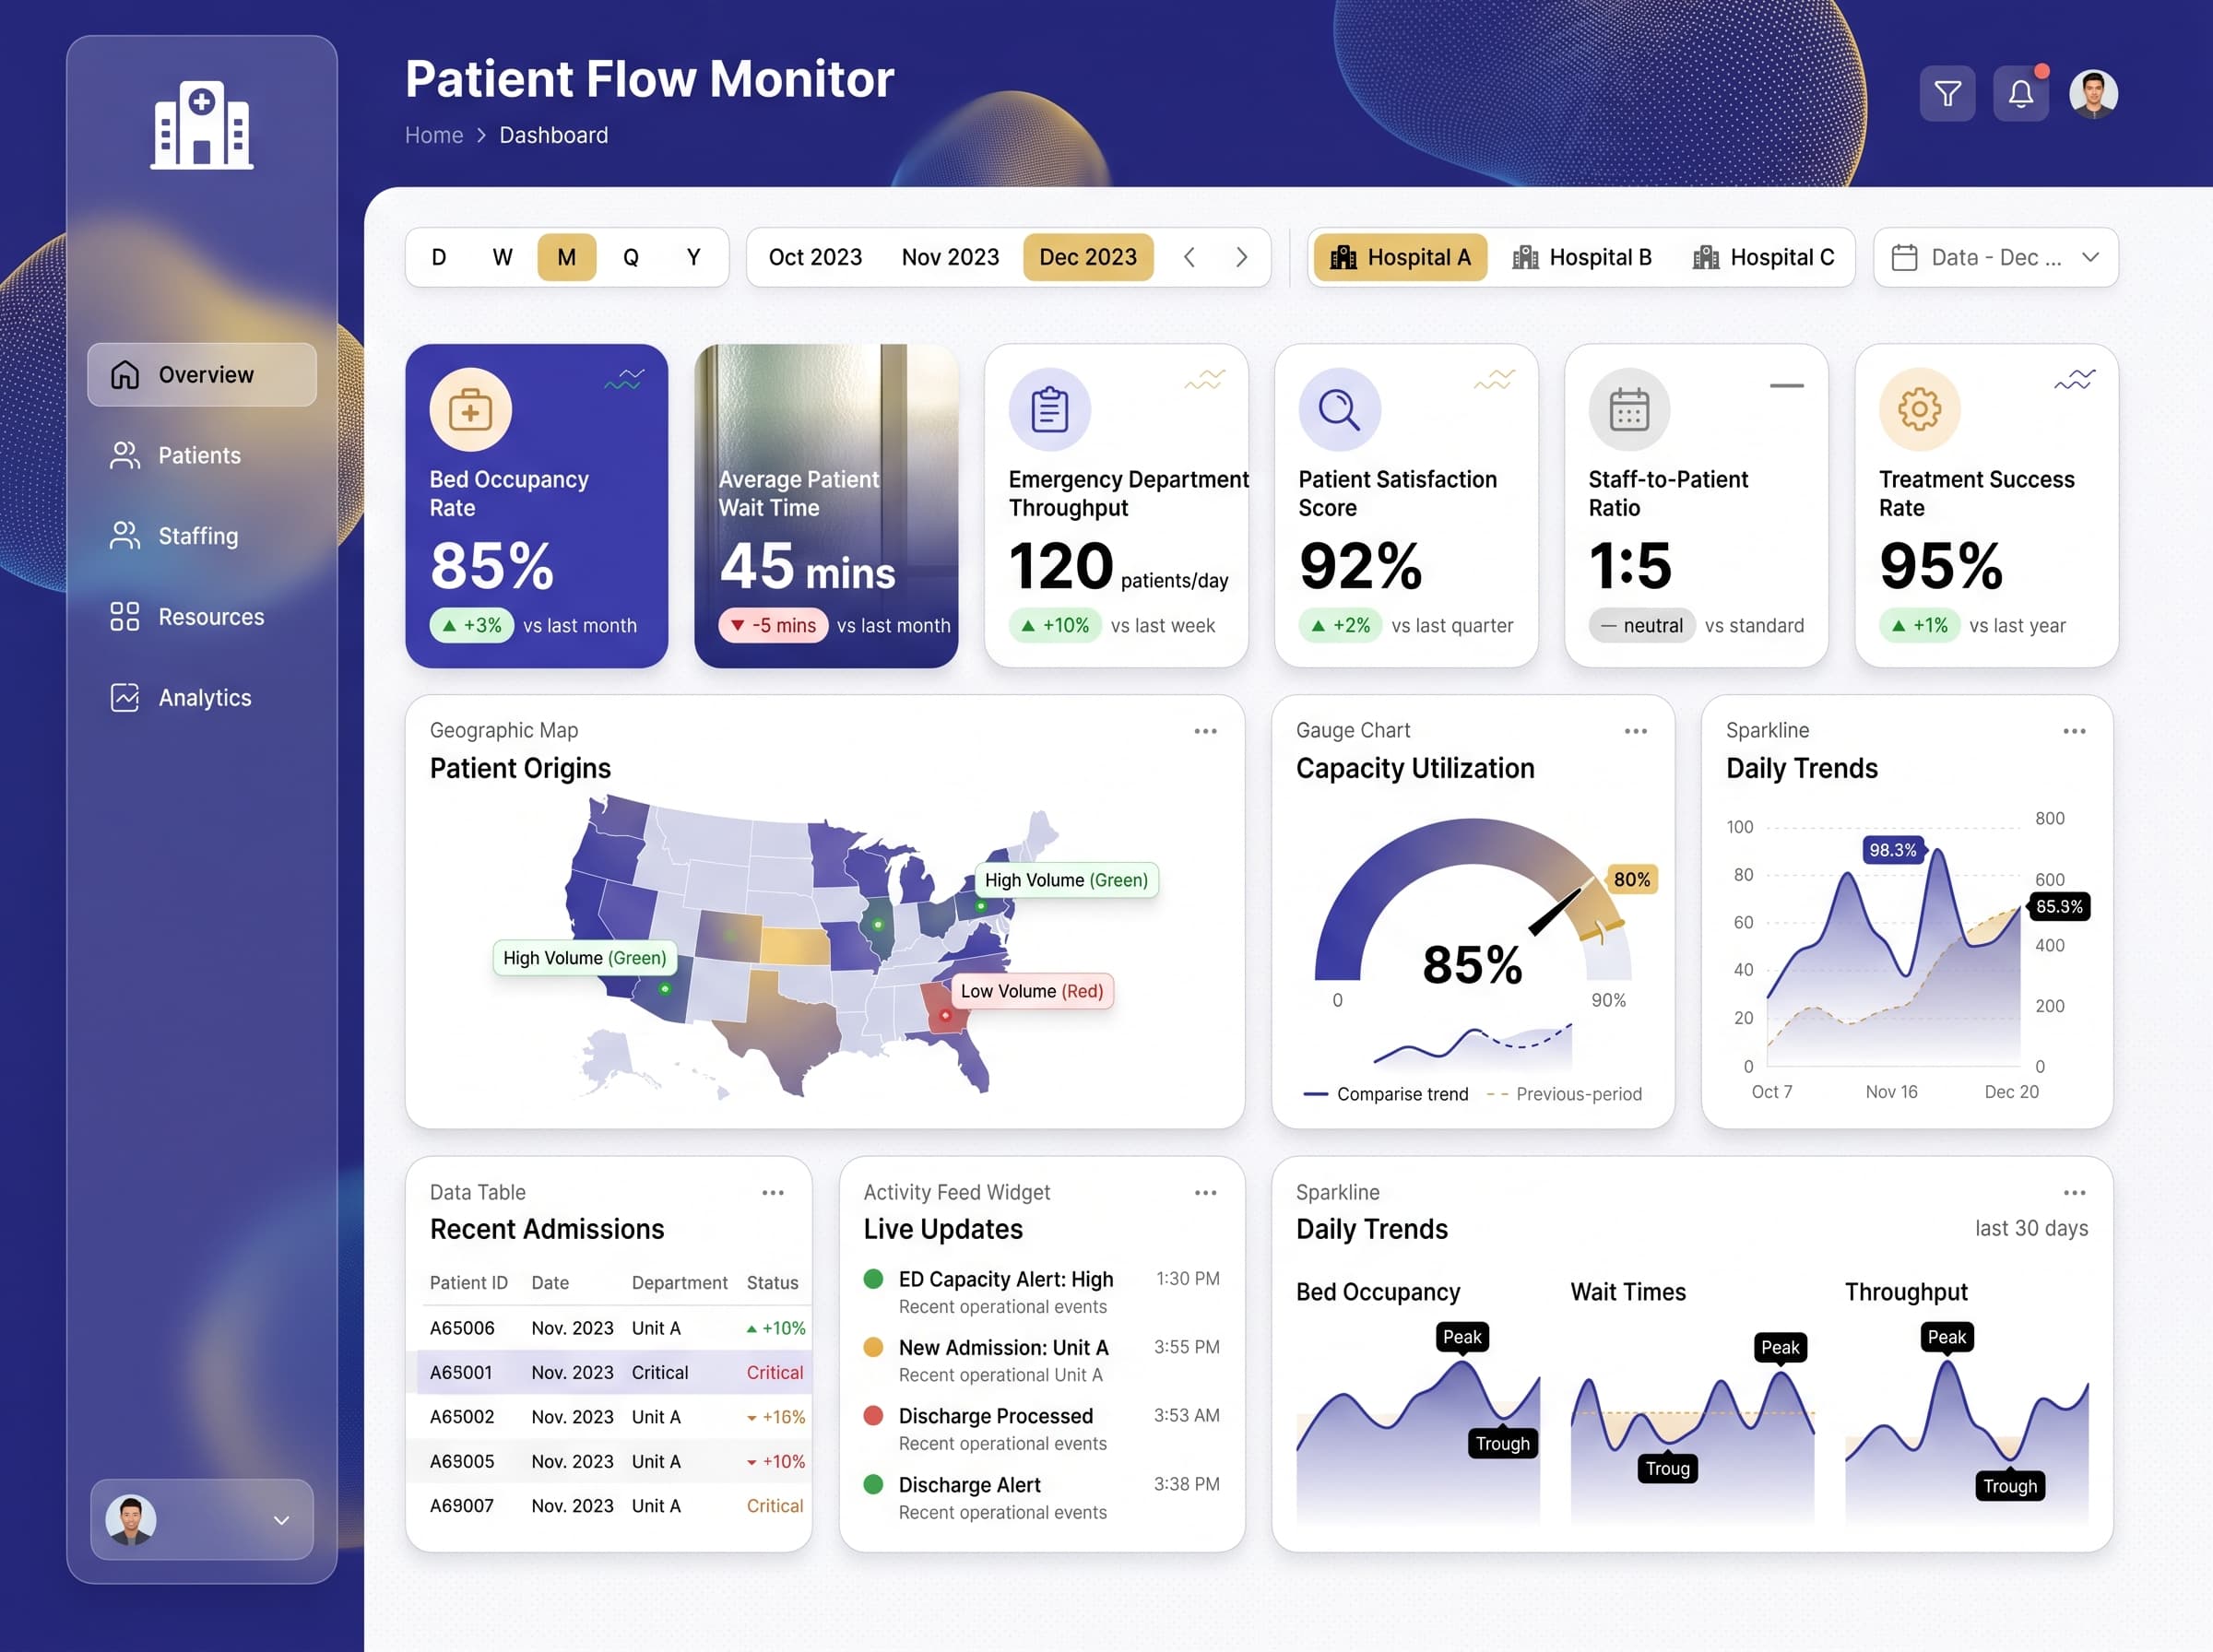
About this dashboard
Comprehensive tracking of patient outcomes, complication rates, mortality index, and care quality scores across units.
KPIs tracked
Charts
Strategic insights
Design recommendations
Color Palette Strategy
HighUtilize a charcoal-gold palette effectively by applying charcoal for backgrounds and headers, while using gold for key metrics and highlights to create a clear visual hierarchy. Ensure a 4.5:1 contrast ratio for accessibility.
Layout & Grid System
HighImplement a 12-column grid system to maintain a 4:3 ratio, placing KPIs at the top for immediate visibility, followed by charts in the middle sections. Maintain 16-24px padding with 16-20px gaps to ensure clarity.
Typography Hierarchy
MediumUse a clear typography hierarchy: dashboard title at 24-28px bold, section headers at 18-20px semibold, and body text at 12-14px regular. Consistently use a single font family such as Segoe UI for uniformity.
Data Visualization UX
HighChoose visualization types that align with data semantics: Multi-Line Charts for trends, Scatter Plots for correlation analysis, and Heatmaps for distribution insights. Limit colors to 5-7 per chart, and ensure axes are clearly labeled.
Visual Hierarchy & Focus
MediumCreate a clear visual hierarchy by making the most important KPIs the largest and boldest. Use whitespace effectively to separate sections and apply conditional formatting to highlight anomalies in performance metrics.
Interaction & Feedback
LowIncorporate hover states for interactive elements and visual feedback during data refresh. Consider adding drill-through navigation for deeper insights into specific metrics.