

Free Power BI report
Manufacturing Overview
Output, yield and downtime per line, with Deneb charts in an amber and clay palette.
Amber Clay · Manufacturing · Deneb charts · 9.7 MB zip · PBIP, PBIR, TMDL · Power BI Desktop for Windows
A hero chart page: the banner with open tickets, fill rate and backlog, five KPI cards, then one large Deneb slope chart of revenue by segment.
- Pages
- 3Pages
- KPI cards
- 17KPI cards
- Deneb charts
- 9Deneb charts
- Slicers
- 4Slicers
Inside
Every page, ready to bind.
Cards, charts and slicers read measures of a sample model shipped inside the project. Replace its Data table with yours and the visuals follow.
- 01Overview5 cards · 1 charts · 2 slicers
- 02Production6 cards · 6 charts · 2 slicers
- 03Quality6 cards · 2 charts · 0 slicers
Open it
Three steps, no sign-in.
- 01Unzip the project anywhere on your Windows machine.
- 02Open the .pbip file with Power BI Desktop (free).
- 03Click Refresh once: the sample data lives inside the project.
Reproducible
Same settings, same file.
Forge is deterministic: the same settings and the same compiler version give the same .pbip, byte for byte. This one was compiled by ChartCraft 2026.10.1 and its zip fingerprint is ad73db26281f. Forge this layout and you start from exactly what you see here.
More free reports
Take another one apart.
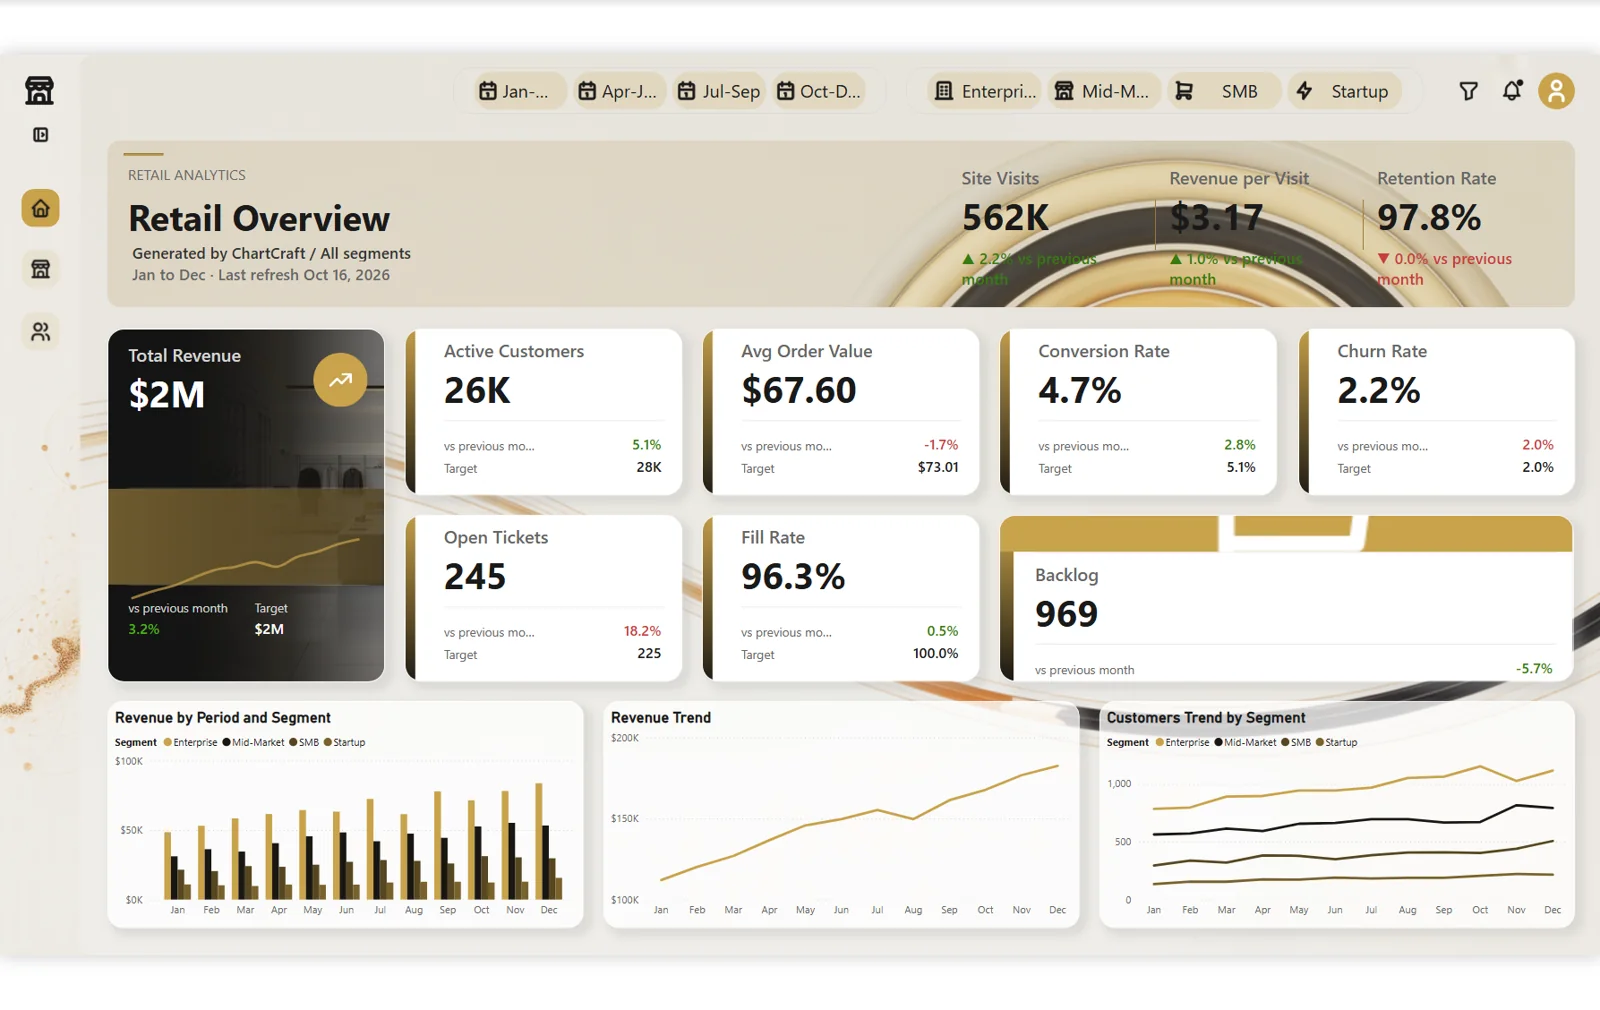
Retail Overview
Revenue, basket and conversion across stores and customer segments, in a warm light palette.
See the report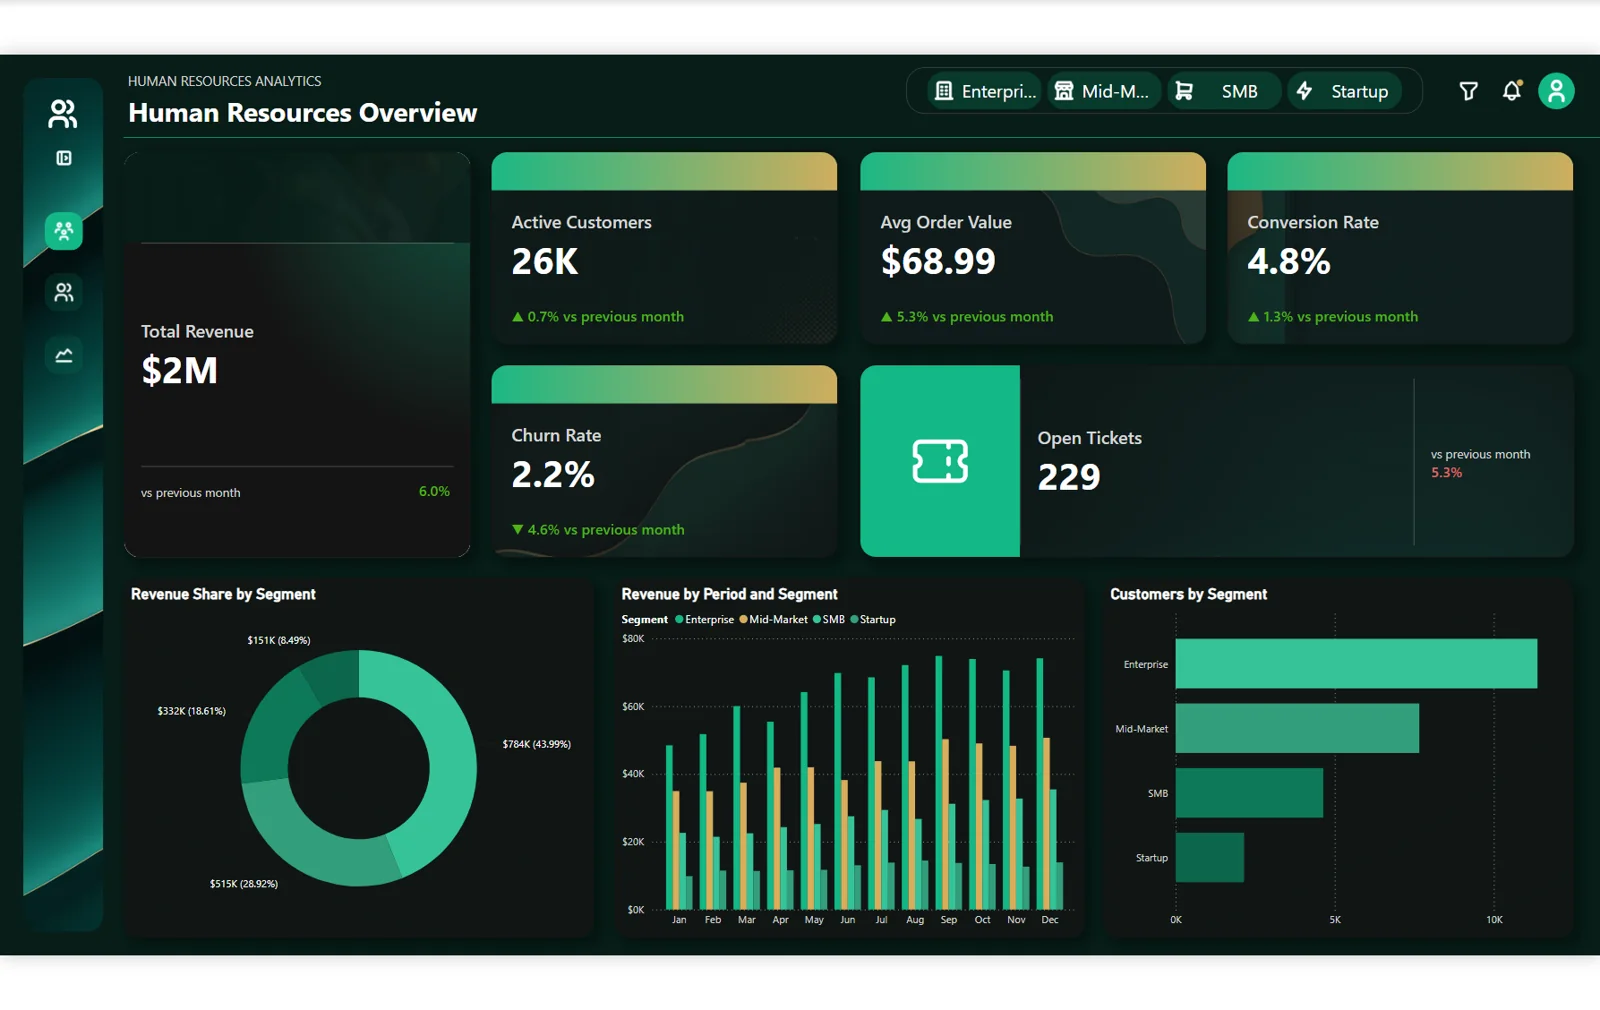
People Analytics
Headcount, hiring and retention on a dark report, with editorial cards and a floating sidebar.
See the report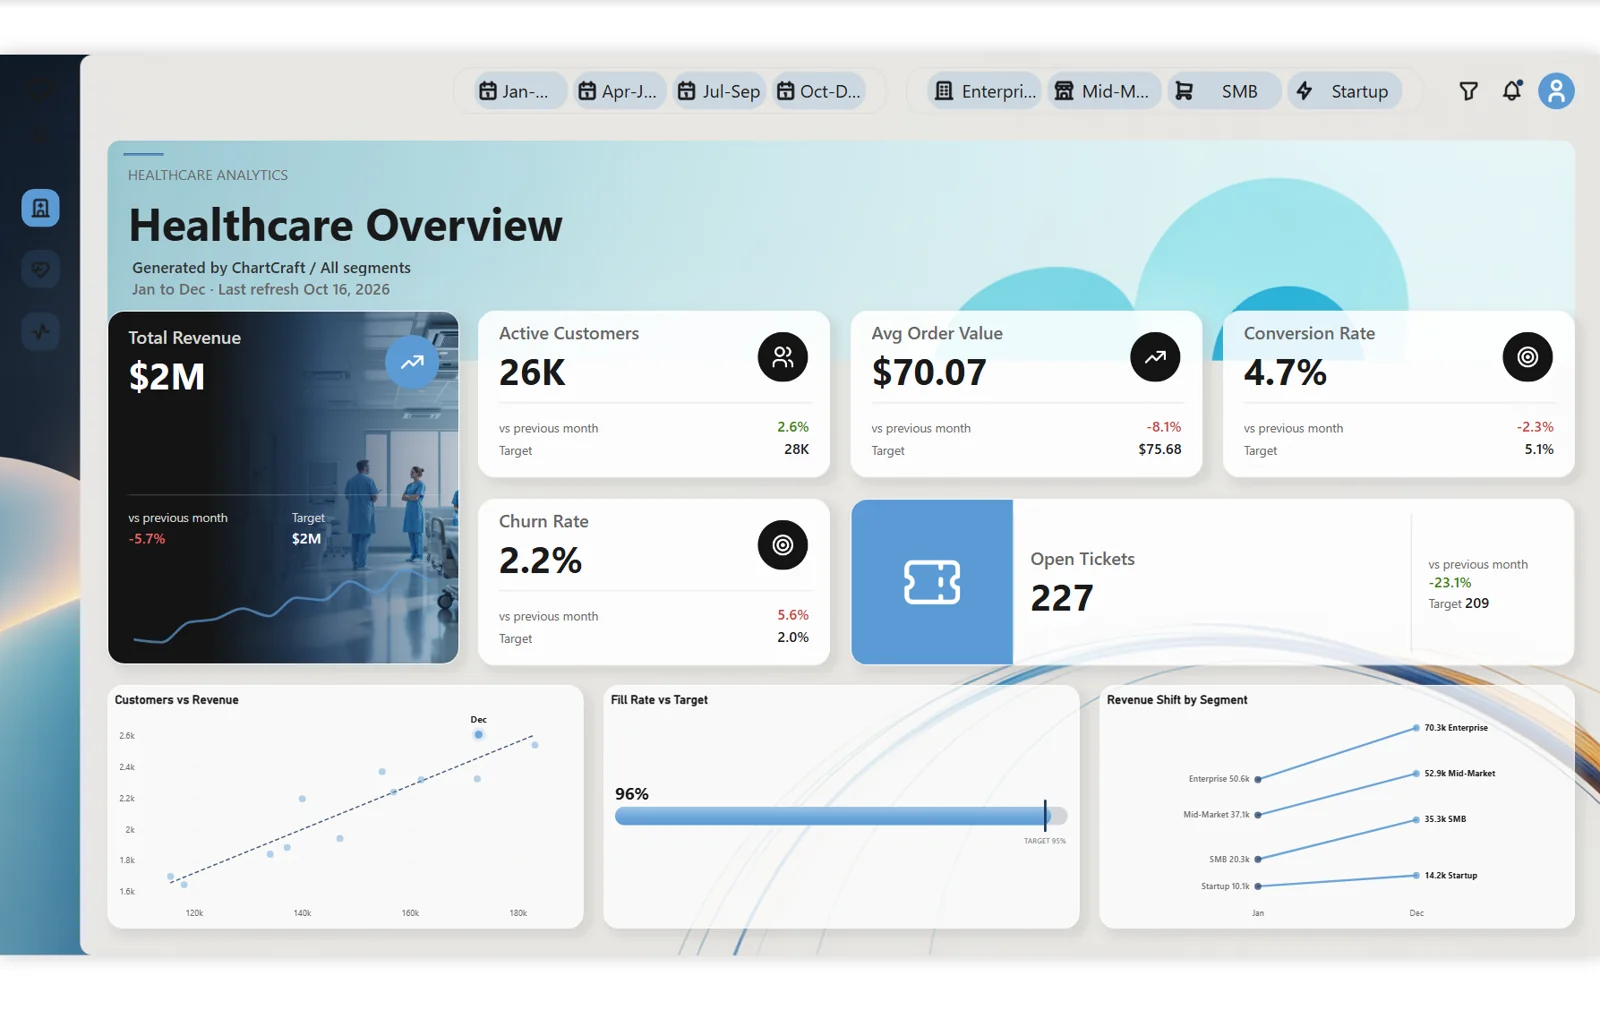
Healthcare Operations
Admissions, length of stay and capacity, drawn with Deneb charts on a clinical blue palette.
See the report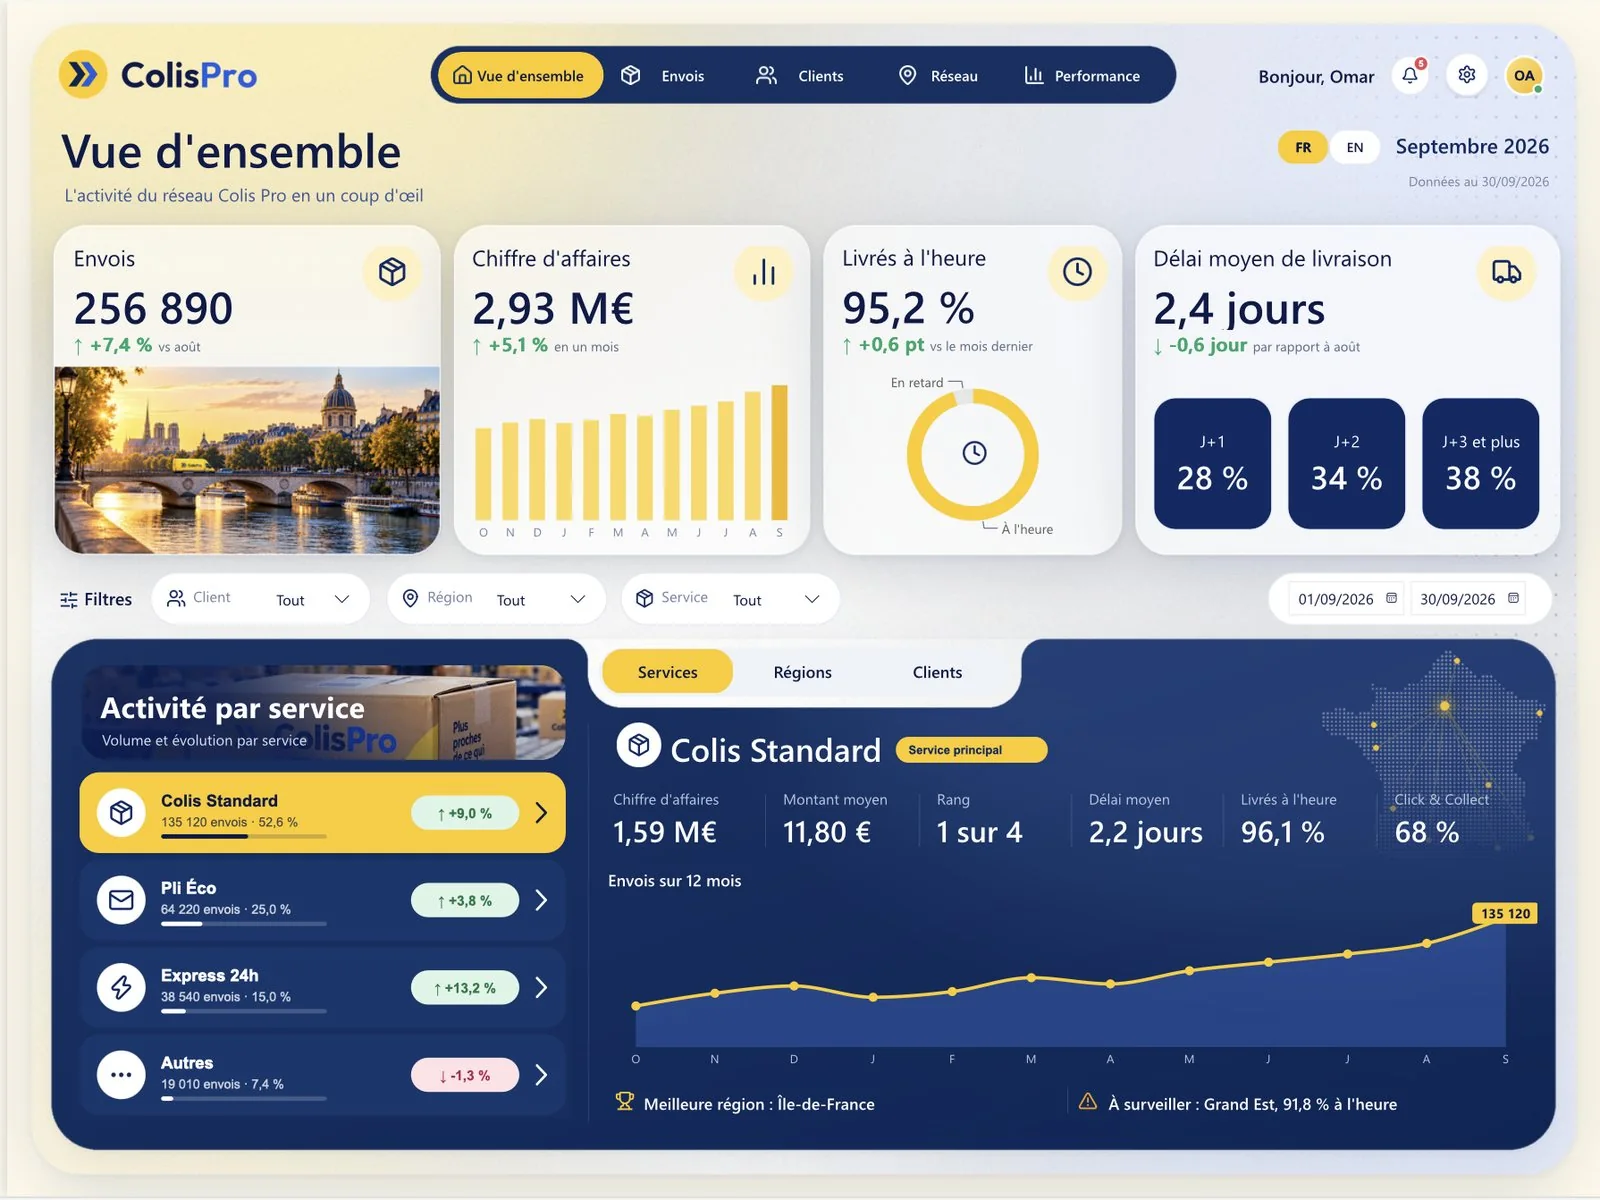
Colis Pro
A parcel carrier report built by hand with an AI agent: five pages, an alerts panel and a settings panel, French and English.
See the report